


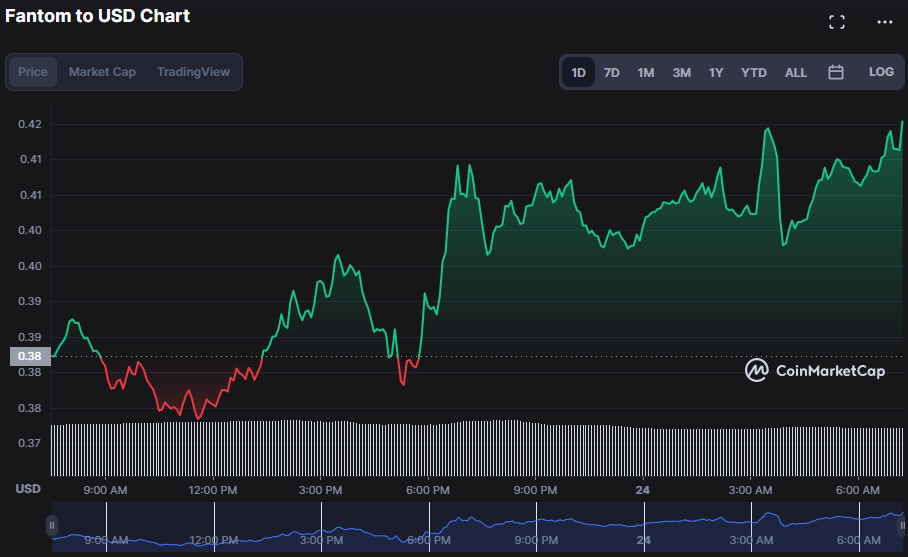
- FTM market finds support at $0.373 and faces at resistance at $0.4155
- According to FTM research, there is a high bullish market outlook.
- Indicators alert traders on the possibility of a trend reversal.
Over the last day, the price of Fantom (FTM) has been on a rising trend, reaching an intra month high of $0.4155. Bears attempted to grab the market early in the day, but the FTM market found support around $0.373. As a result of the bullish surge, the bulls successfully valued the FTM price at $0.4153, a 8.59% rise.
The market capitalization of the FTM increased by 8.26% to $1,147,457,027 as a result of growing market interest. The 24-hour trading volume, however, dropped by 6.05% to $377,457,158, indicating that the positive price action is losing support.
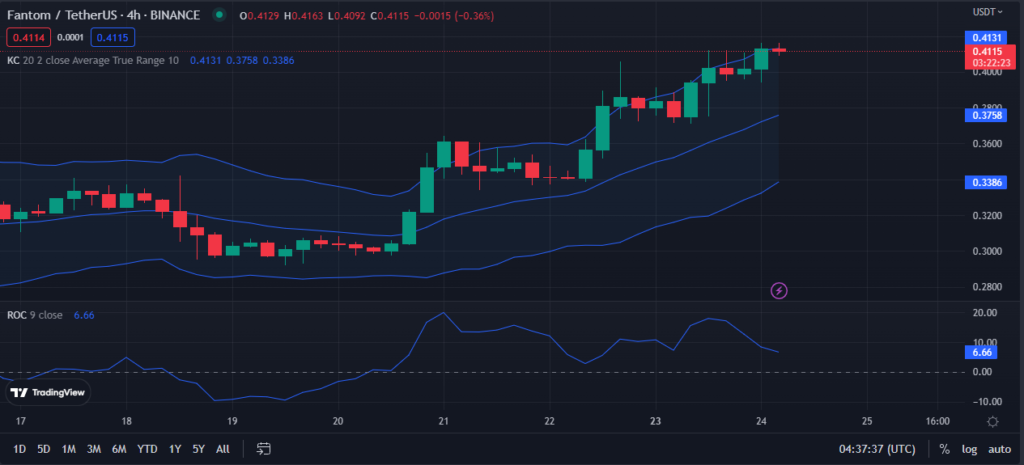
Rising Keltner channel bands (upper band 0.4132, lower band 0.3386) indicate a rising FTM market, with traders likely taking profits at the top band and purchasing at the bottom band. The large gap between the upper and lower bands indicates that buyers and sellers are equally optimistic about the FTM market’s upward trend. However as the price action tries to break above the upper band, an overbought market is projected cautioning traders .
The FTM market’s Rate of Change (ROC) reading of 6.87 which is heading southward signals that the bullish sentiment is declining and negative sentiment is increasing. This indicates that a bearish trend is brewing. This fall in positive sentiment and increase in negative sentiment put the FTM market’s rising momentum into doubt, indicating that a bearish trend is likely.
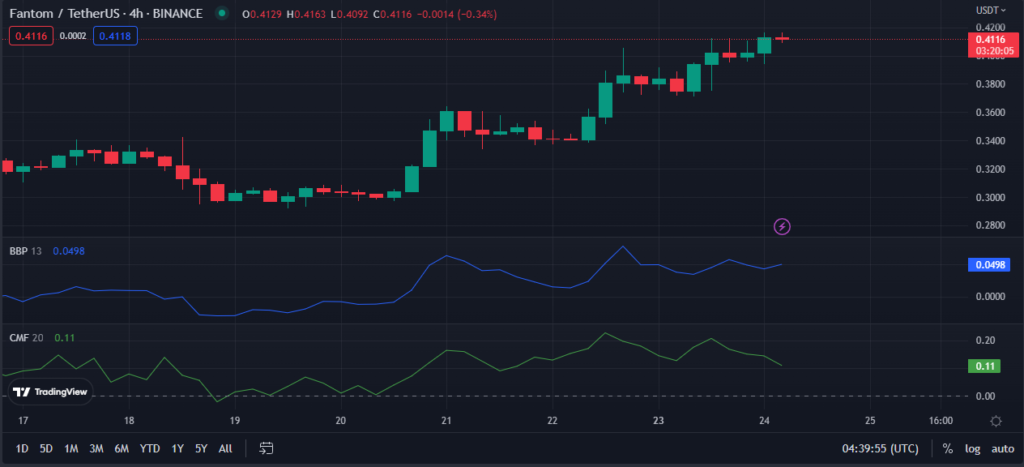
A BBP reading of 0.0499 on the FTM price chart shows that bullish momentum is fading and that gloomy sentiment may soon take over. However, while the BBP line continues to move north, the FTM price chart’s upward trend is expected to continue. If bullish pressure continues, a breakthrough might occur, establishing a new monthly high.
The FTM market’s Chaikin Money Flow (CMF) is positive at 0.11, reinforcing the notion that bulls are in control. This movement indicates that investors are buying more than they are selling, and that investor sentiment about the FTM market is typically favourable, strengthening traders’ hopes of a protracted bull run.
In order to achieve more price gains in the FTM market, bulls must propel prices higher and defend the current resistance level.
Disclaimer: The views and opinions, as well as all the information shared in this price analysis, are published in good faith. Readers must do their own research and due diligence. Any action taken by the reader is strictly at their own risk, Coin Edition and its affiliates will not be held liable for any direct or indirect damage or loss.
Disclaimer: The information presented in this article is for informational and educational purposes only. The article does not constitute financial advice or advice of any kind. Coin Edition is not responsible for any losses incurred as a result of the utilization of content, products, or services mentioned. Readers are advised to exercise caution before taking any action related to the company.
 Price Prediction 2026-2030: Will TRX Hit $0.50 Soon?")
 Price Prediction 2026-2050: Will HYPE Hit $100 Soon?")


: What Happens If You Use an Unlicensed Platform?")