


 Persists Despite Early Bear Supremacy")
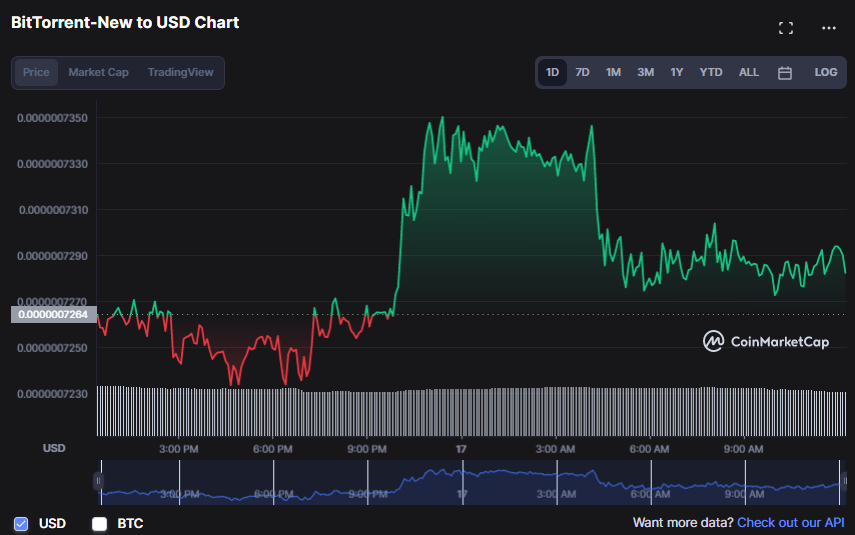
- BTT’s price rose after finding support at $0.0000007232.
- If bulls hold on to the resistance level, indicators point to greater price growth in the near future.
- In order to reach new highs, bulls must exert pressure to overcome resistance.
After a prolonged bullish run that pushed prices up to $0.0000007359 (a monthly high), bulls have retaken control of the BitTorrent (BTT) market. Within the trading day, the bears were able to push the price of BTT down to its intraday low of $0.0000007232. However, at the time of writing, bulls had pushed the price of BTT up to $0.0000007289, a 0.40% gain.
With the recent price increase, BTT market capitalization rose by 0.37% to $693,373,563, signalling that bulls may be regaining ground and gradually reclaiming control of the BTT market. However, the fact that the 24-hour trading volume fell 12.22% to $12.258,672 suggests that investors should cash in their gains.
The Bollinger bands are moving linearly, with the upper band at 0.0000007340 and the lower band at 0.0000007187, indicating that the market is stabilising. This movement could indicate a trend reversal or, at the very least, a break from the current downward trend. This action serves as a warning to traders to exercise caution when trading BTT, as it may be approaching a tipping point.
BTT is in the midst of a trend reversal, as indicated by an Aroon up reading of 35.71% and an Aroon down reading of 14.29%, both pointing downward. This action boosts traders’ confidence in BTT and encourages them to keep a close eye on the stock and its potential future path.
Further negative momentum is likely in the immediate term as the MACD blue line in the BTT price chart trends below its signal line with a reading of 0.0000000113. The tendency of the histogram in the negative zone supports this bear run, indicating that the downward pressure is prevalent in the BTT market.
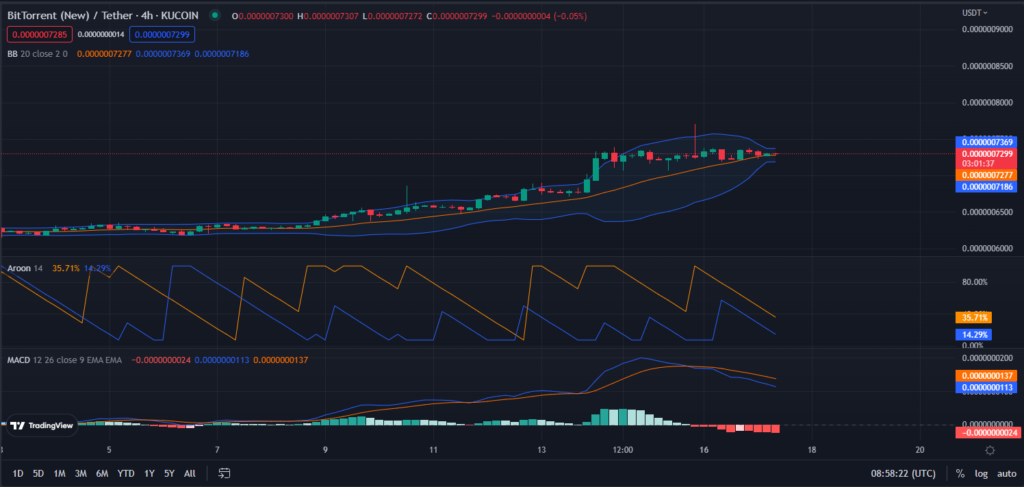
BTT/USD 4-hour price chart (source: TradingView)
The 10-day moving average (0.0000007295) crossing over the 50-day moving average (0.0000006903) indicates that bulls are gaining strength in the BTT market. Because the 50-day moving average (MA) is a vital support level, a move above it may entice investors to re-enter the market, resulting in a price rebound. This market downturn reflects traders’ efforts to maximise their profits ahead of a BTT price rebound.
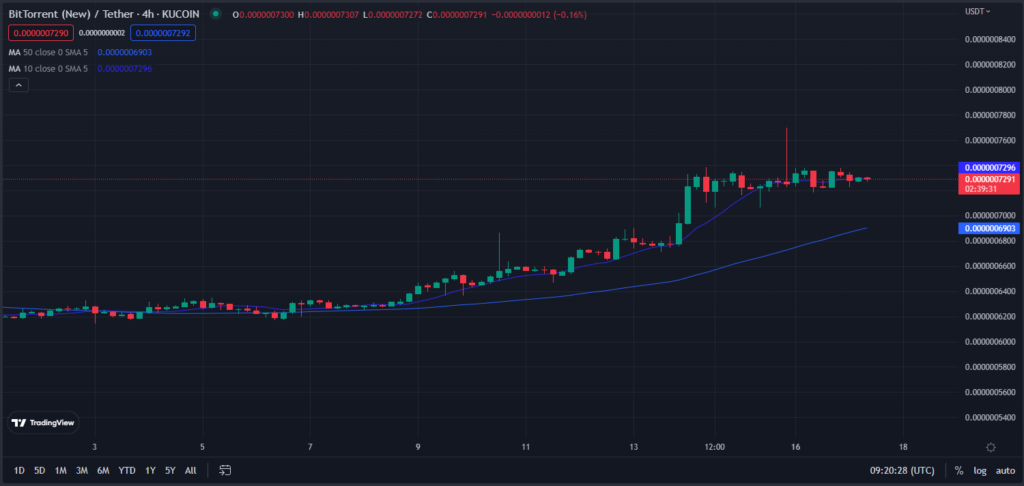
According to the technical indicators, prices will continue to rise as long as buyers remain confident in the BTT market.
Disclaimer: The views and opinions, as well as all the information shared in this price analysis, are published in good faith. Readers must do their own research and due diligence. Any action taken by the reader is strictly at their own risk, Coin Edition and its affiliates will not be held liable for any direct or indirect damage or loss.
Disclaimer: The information presented in this article is for informational and educational purposes only. The article does not constitute financial advice or advice of any kind. Coin Edition is not responsible for any losses incurred as a result of the utilization of content, products, or services mentioned. Readers are advised to exercise caution before taking any action related to the company.
 Price Prediction 2026, 2027, 2028, 2029, 2030 -2050")


