- MATIC price finds support at $0.6887 amid bearish pressure.
- Rising trading volume indicates increased interest in MATIC and heightened volatility.
- The widening Bollinger bands suggest potential upward price movement.
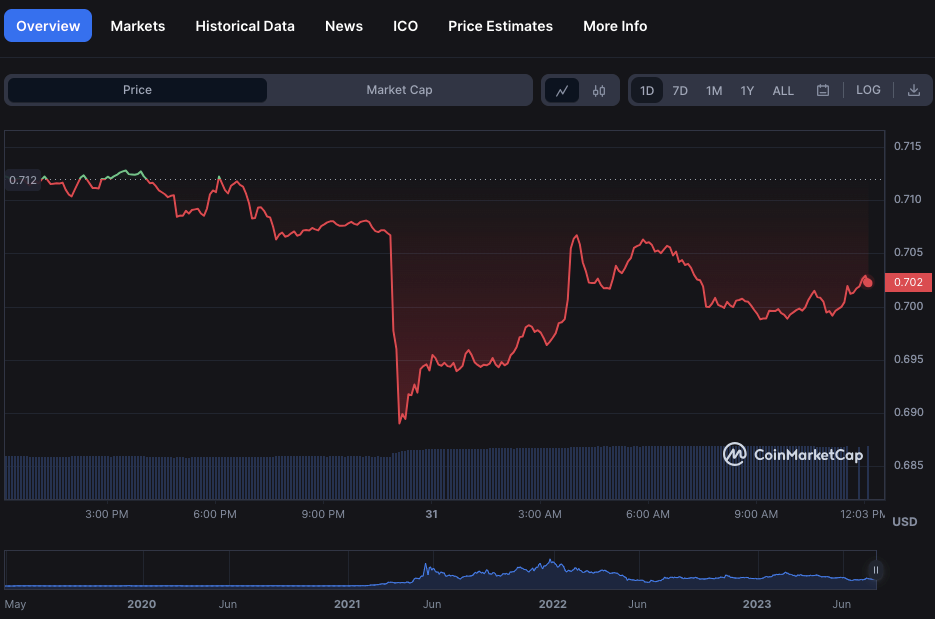
Polygon (MATIC) bears have outnumbered bulls in the previous 24 hours, with bullish attempts to recoup failed after falling short of the $0.7129 resistance. As a result, MATIC’s price fell to a 24-hour low of $0.6887, where it found some support.
The MATIC price currently trades at $0.7012, indicating a slight rebound from the 24-hour low. If bulls break over the $0.7129 barrier, it might suggest a trend reversal and a shift in sentiment toward the bulls. However, if bears continue to maintain pressure and thwart a breakout, the price may fall lower near crucial support levels.
MATIC’s market capitalization fell by 1.50% to $6,538,892,166, while its 24-hour trading volume increased by 21.81% to $237,828,251. This rise in trading volume indicates more activity and interest in MATIC. Many buyers and sellers may be in the market, leading to heightened volatility and price fluctuation.

The Bollinger bands are broadening on the 3-hour price chart, and the price action has bounced off of the bottom band, signalling a probable upward advance in price. The upper and lower bars intersect around 0.725 and 0.696, indicating a range-bound market for MATIC. Traders may seek entry points to purchase around the lower band and exit points to sell near the upper band.
With a value of 0.08, the Chaikin Money Flow (CMF) move into the positive zone indicates a minor infusion of purchasing pressure in the market. This movement suggests that more traders are entering positions expecting a price increase. If the CMF remains positive or rises further, it might signal more buying pressure and could lead to a breach above the upper zone.

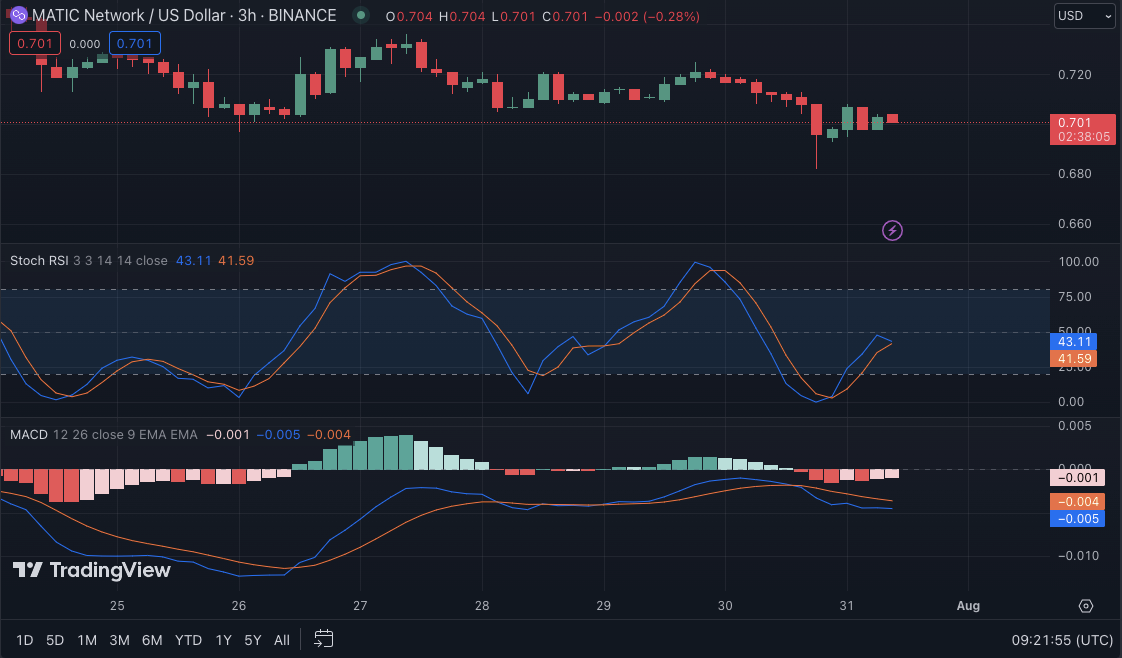
Currently, the negative momentum in the market is weak, as shown by the MACD reading -0.04. This pattern indicates a lack of selling pressure and the possibility of a quick turnaround. A MACD crossover above the zero line might mean a change towards positive momentum. Traders should watch for this signal, which might signify a potential trend reversal and a chance for long positions.
The stochastic RSI rating of 44.14 also lends credence to a possible trend reversal. Although the market is not yet oversold, the signal shows it is not overbought either. This level implies a balanced degree of buying and selling pressure, indicating the possibility of a quick turn towards bullish momentum. This trend benefits traders trying to establish long positions and profit from a possible rally.

In conclusion, MATIC’s price analysis points to potential bullish opportunities as bears lose steam and buying pressure gains momentum. Traders should watch for key resistance levels for a possible trend reversal.
Disclaimer: The views, opinions, and information shared in this price prediction are published in good faith. Readers must do their research and due diligence. Any action taken by the reader is strictly at their own risk. Coin Edition and its affiliates will not be liable for direct or indirect damage or loss.
Disclaimer: The information presented in this article is for informational and educational purposes only. The article does not constitute financial advice or advice of any kind. Coin Edition is not responsible for any losses incurred as a result of the utilization of content, products, or services mentioned. Readers are advised to exercise caution before taking any action related to the company.


