


- XRP battles between bulls and bears, showing resilience.
- Trading volume drops as cautious sentiment lingers in the XRP market.
- The overbought signal suggests a possible reversal for the XRP price.
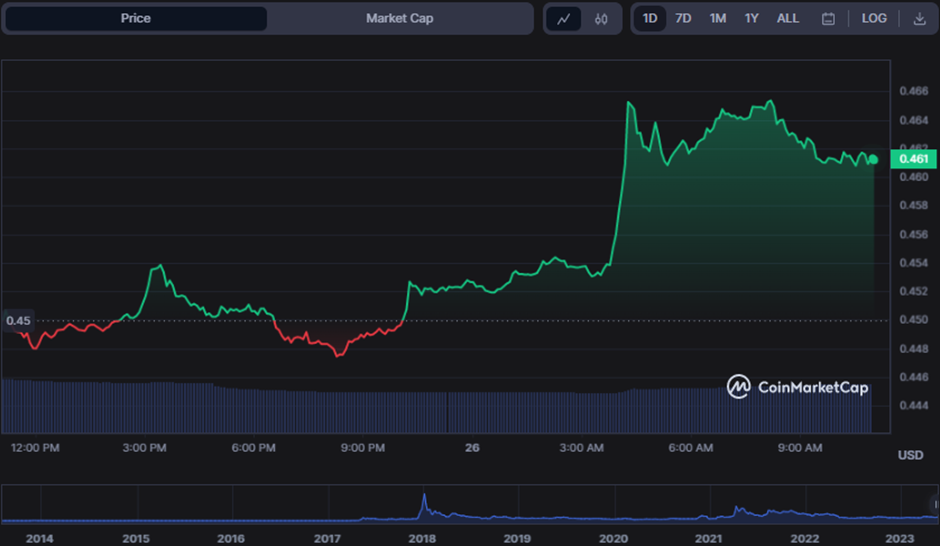
The XRP price battled between the bears and the bulls yesterday, as it saw a narrow trading range with a low of $0.4456 and a high of $0.4546. The market opened at $0.4536, with the bulls attempting to increase the price.
However, the bears fought back, resulting in a slight dip, and the day closed at $0.4537. Today, a new monthly low of $0.4472 was established, testing the bulls’ resilience. Bulls, however, have nullified the negative trend resulting in a 2.55% surge to $0.4614 as press time despite facing resistance at $0.4661.
XRP’s market capitalization increased by 2.65% to $23,944,024,717, but its 24-hour trading volume decreased by 11.06% to $841,565,656 during the bull-bear duel. This drop shows that some traders may have chosen to remain on the sidelines or take gains, reflecting the cautious mindset prevalent in the XRP market.
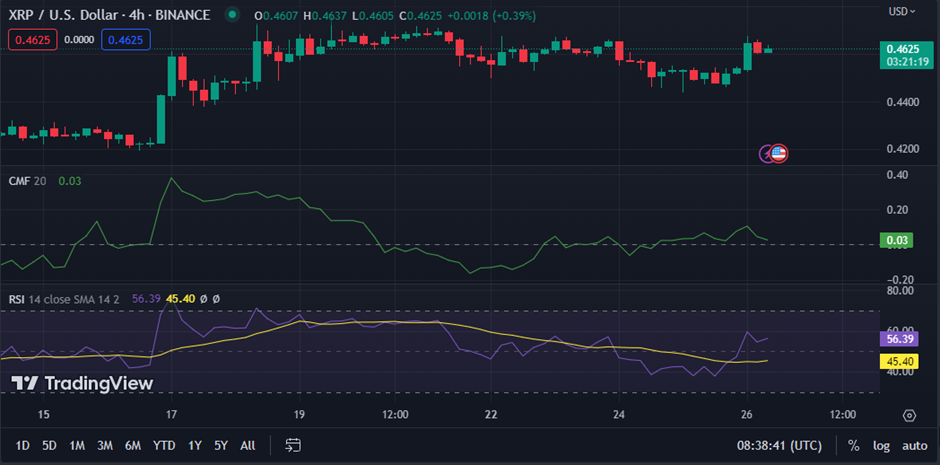
The Chaikin Money Flow on the XRP/USD 4-hour price chart is heading lower with a level of 0.03, indicating that bullish strength is fading. The CMF’s movement and the decrease in trading volume indicate that capital outflows increase as traders take gains and exit their positions.
The Relative Strength Index rating of 56.97, on the other hand, indicates that the market is currently in a neutral zone, with neither the bulls nor the bears holding a clear edge. This might indicate that the market briefly pauses before continuing its upward or negative trend.
When the RSI rises over 60, the bulls may gain ground, and the buying pressure will increase in the market. However, if the RSI falls below 50, it may indicate that selling pressure is building and the bears are gaining control hence the need to set stop-losses.
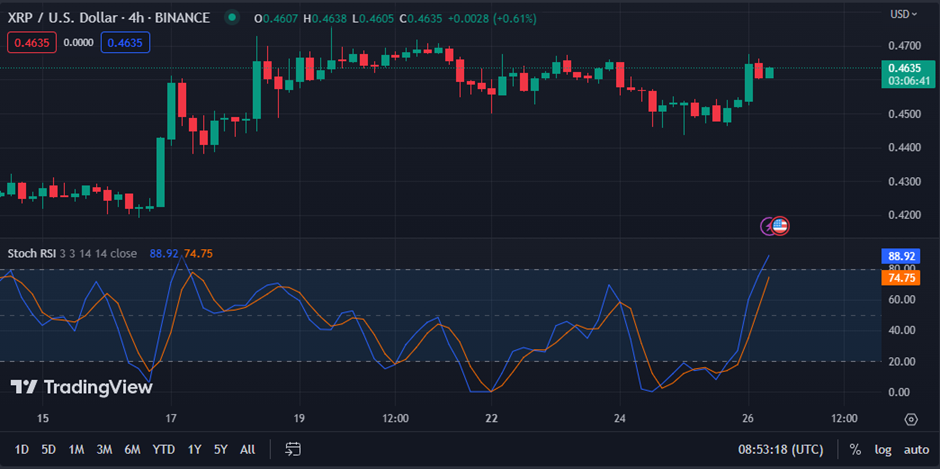
The stochastic RSI value of 88.29 on the XRP/USD price chart indicates that the market is overbought. This movement warns traders that the market’s bullish momentum may have peaked and that a reversal is possible.
Overboughtness at this level is often seen as a signal to take gains, exit long positions, or even consider shorting XRP.
In conclusion, XRP’s price battles between bears and bulls showing signs of caution and possible reversal as market indicators hint at fading bullish strength and overbought conditions.
Disclaimer: The views, opinions, and information shared in this price prediction are published in good faith. Readers must do their research and due diligence. Any action taken by the reader is strictly at their own risk. Coin Edition and its affiliates will not be liable for direct or indirect damage or loss.
Disclaimer: The information presented in this article is for informational and educational purposes only. The article does not constitute financial advice or advice of any kind. Coin Edition is not responsible for any losses incurred as a result of the utilization of content, products, or services mentioned. Readers are advised to exercise caution before taking any action related to the company.

 Price Prediction 2026, 2027, 2028, 2029, 2030-2050")


