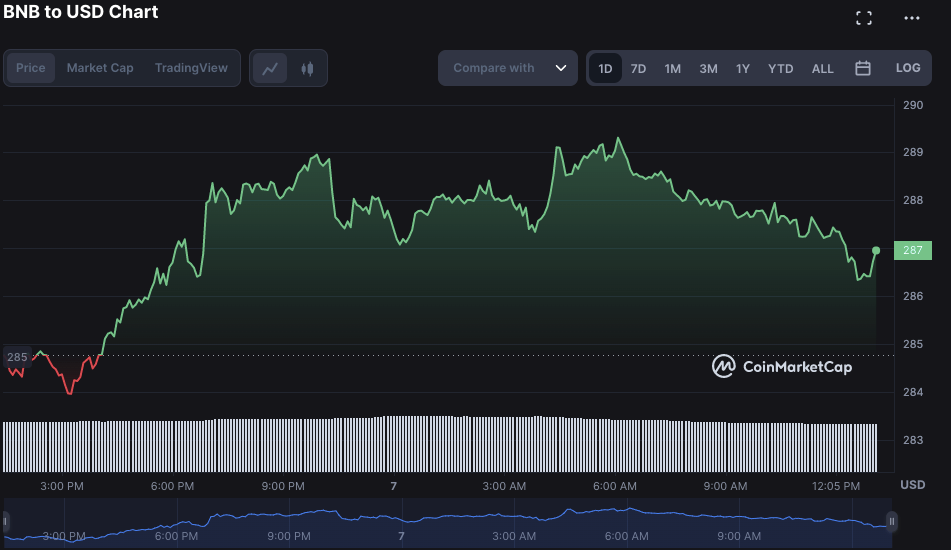
- Binance coin shows a positive trend at $286.92 as the bulls drive the market higher.
- The BNB/USD has surged by over 0.60% in the last 24 hours after a bullish run.
- A resistance level for the BNB token has been formed near $289.53.
The recent Binance coin price analysis indicates that the BNB/USD pair is currently trading above the $283.95 level, which is a key support level for bulls. After a brief period of a fall, the bulls have taken control of the market and are currently recovering. The current market price of BNB stands at $286.92, which is 0.60 percent higher than the opening day’s value of $287.24.

The last 24 hours of trading activity have been relatively positive for bulls, with the daily volume increasing to $325 million. This indicates that buyers are becoming increasingly bullish on the BNB token and may be pushing the price higher while the market cap is also at an all-time daily high of $45 billion.
According to the one-day price chart, the current BNB/USD pair is trading near a resistance level of $289.53. If bulls manage to break this barrier, then it may open up room for further upside potential in the market. On the other hand, there is strong support at the $283.95 level, and any sell-off below this level could spell trouble for buyers.
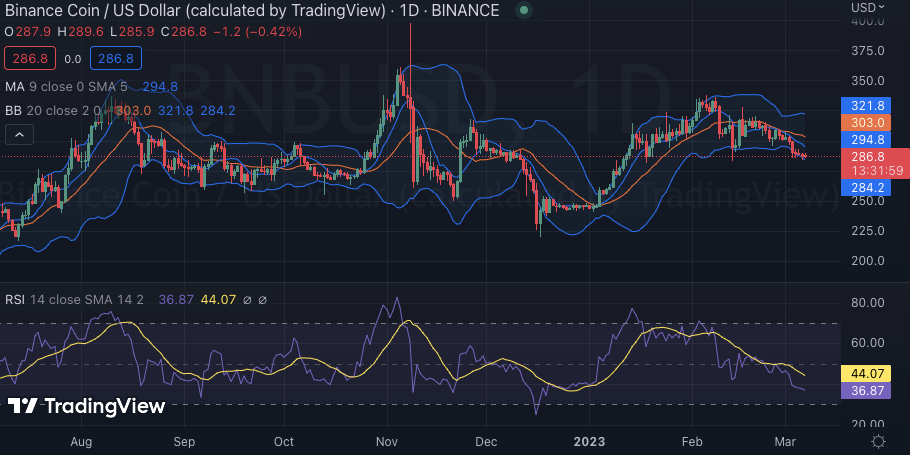
The technical rating indicator is flashing a strong buying signal, indicating that bulls have the upper hand in the short-term market. The relative strength index (RSI) is currently indicating a bullish market environment with readings above 50, and the indices may soon see an upward trend in prices. However, the RSI is fast approaching overbought levels at 73.95, which could indicate a period of consolidation ahead for these assets.

BNB/USD shows high volatility in the short term, with the upper limit of Bolinger bands at $321.8 and a lower limit set to $284.2. With the current market sentiment favoring bulls, traders can expect a breakout above this range in the upcoming days as the Binance coin is expected to continue its uptrend. The 50-day and 200-day moving averages are also converging, which could indicate a strong bull run ahead for BNB.
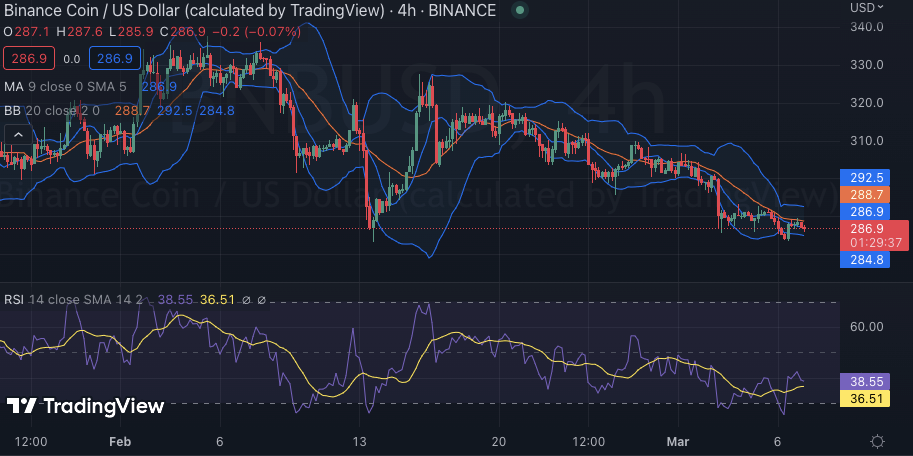
On the hourly chart for the BNB token, the bulls are still in full control of the market. The Binance coin has been trading in range-bound between $283.95 – $289.53 for the past few hours, and buyers are most likely to break out of this range soon. The price is currently trading above the moving average indicator at $286.9, which indicates that a bullish market may be on the horizon for BNB/USD.

The shorter-term SMA 20 is above the SMA 50, and volatility on the 4-hour chart appears to be average. Both the upper and lower bounds of Bollinger Bands are visible at $292.5 and $284.8, respectively. From an hourly perspective, RSI indicates a stable 38.55 reading with flat curves implying that buyers are still in the game.
In conclusion, BNB/USD is currently trading with bullish sentiment, and the bulls have already taken control of the market. The resistance level at $289.53 may become a critical point for buyers to break above, as this would open room for further upside momentum in price. The indicators also point toward a positive trend in prices, and traders should watch out for any sudden movements in the coming hours.
Disclaimer: The views and opinions, as well as all the information shared in this price analysis, are published in good faith. Readers must do their own research and due diligence. Any action taken by the reader is strictly at their own risk, Coin Edition and its affiliates will not be held liable for any direct or indirect damage or loss.
Disclaimer: The information presented in this article is for informational and educational purposes only. The article does not constitute financial advice or advice of any kind. Coin Edition is not responsible for any losses incurred as a result of the utilization of content, products, or services mentioned. Readers are advised to exercise caution before taking any action related to the company.


