


- Fantom consolidates after an early spike this week; the bulls catapult FTM on the seventh day.
- The bears match the bulls as FTM consolidates throughout the first five days of the week.
- The bulls lose their grip, and FTM could break the regression channel.
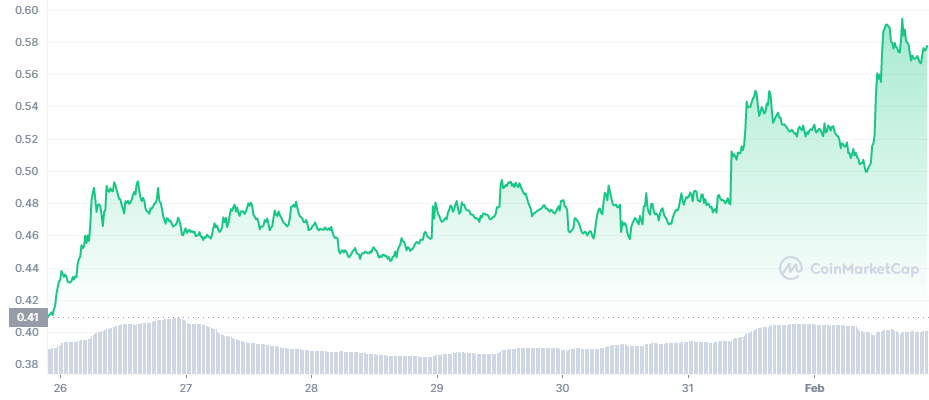
Fantom (FTM) has been moving horizontally with very few vertical fluctuations. The token was changing hands with an opening market price of $0.41. Just a few hours into the first day of the month, FTM surged to $0.49. From the first day to the early hours of the sixth day, FTM traded in a tight range of $0.44-$0.50.
However, the bulls took control on the sixth day and catapulted the price from $0.48 to $0.54 within a few hours. Nonetheless, FTM followed this hike with a decline, and the price crashed to $0.49. On the seventh day of the week, the bulls ran rampant, skyrocketing the prices to a weekly high of $0.57. Currently, FTM is up 9.37% in the last 24 hours and is priced at $0.575.
When considering the 24 hours trading volume on the chart below, there was no increment in the prices with the increased trade volume. FTM displayed the preceding behavior on the first and second days. This shows that the bull-bear power evenly rose with the trading volume.
Contrastingly, there was an increment in prices on the seventh day despite maintaining a constant trade volume. This shows that there has been a shift in the bull-bear power, with the bulls getting a better grip on the market.
When considering the chart below, FTM has been fluctuating in a regression trend channel since the second half of January. Most of its activity was between the Linear Regression Line and Lower Channel Line. However, FTM has currently hit the upper regression channel line. The bulls’ power is at 0.0688 and is tilting downwards, which means the bulls are exhausted.
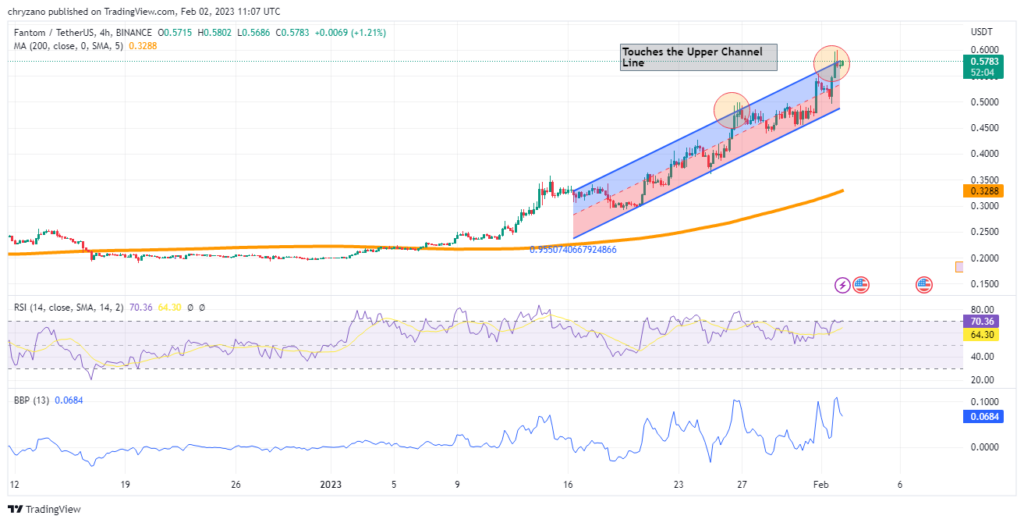
However, the RSI is at 70.09 and overbought, but it is parallel with the horizontal axis, hence the prices could move either way. As such, traders holding a long position must watch out. If the bulls give in to the bears, those going long should have second thoughts on their strategy.
If the bears take over, this will present a chance for those going short to sell their asset at higher prices and buy back at a lower price. Nevertheless, this could be another instance where FTM goes back to the lower channel line and rebounds in the regression channel. But the question is whether FTM will have the momentum to bounce back after hitting the lower channel line.
Disclaimer: The views and opinions, as well as all the information shared in this price analysis, are published in good faith. Readers must do their own research and due diligence. Any action taken by the reader is strictly at their own risk, Coin Edition and its affiliates will not be held liable for any direct or indirect damage or loss.
Disclaimer: The information presented in this article is for informational and educational purposes only. The article does not constitute financial advice or advice of any kind. Coin Edition is not responsible for any losses incurred as a result of the utilization of content, products, or services mentioned. Readers are advised to exercise caution before taking any action related to the company.


