


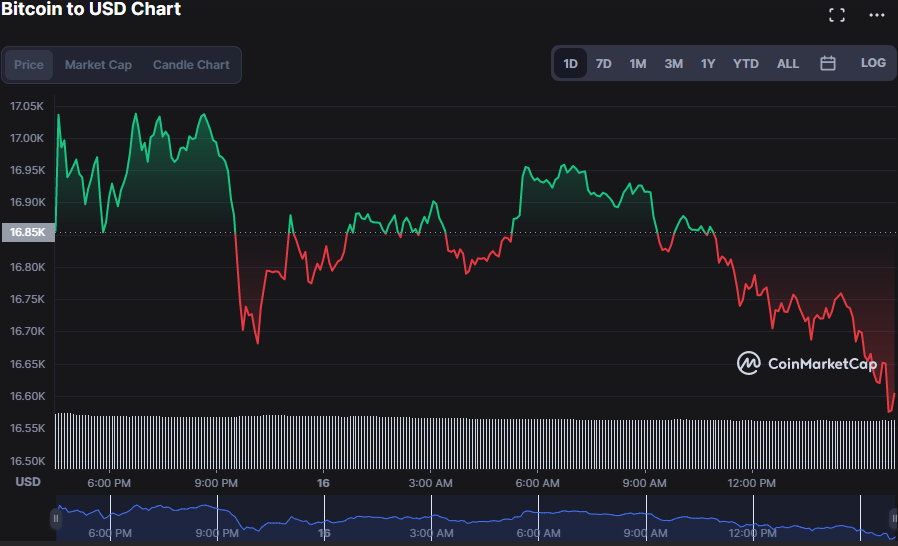
- According to analysis, BTC has been in a downward trend, which may persist.
- Bitcoin is facing stiff resistance at its intraday high of $17,051.96.
- BTC bulls must keep on fighting to wrap up bear dominance.
Bitcoin (BTC) has seen an ambivalent market trend as bears and bulls compete to seize market control. However, the bulls were annihilated in recent hours, as prices fell by 2.25% to $16,594.90.
This negative market trend is chalked up to a 1.55% decrement in market capitalization to $318,562,851,315 and a 12.38% drop in 24-hour trading volume to $34,898,693,505.
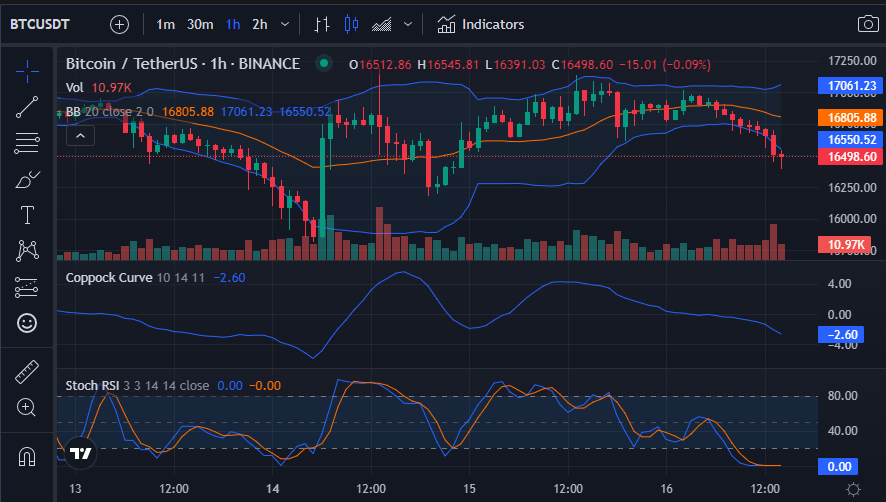
The BTC market is experiencing escalating selling pressure, with the Bollinger Bands widening as the upper band touches 17064.52 and the lower band touches 16548.12. The bearish engulfing candlestick pattern gives credence to this bearish trend.
With a reading of -2.56, the Coppock curve is trending south, denoting that bear supremacy is on the form.
Investors are optimistic because a Stoch RSI reading of 0.00 indicates an oversold region and anticipates a bullish reversal in the near term. Still, it is only partially certain that prices will revert higher.
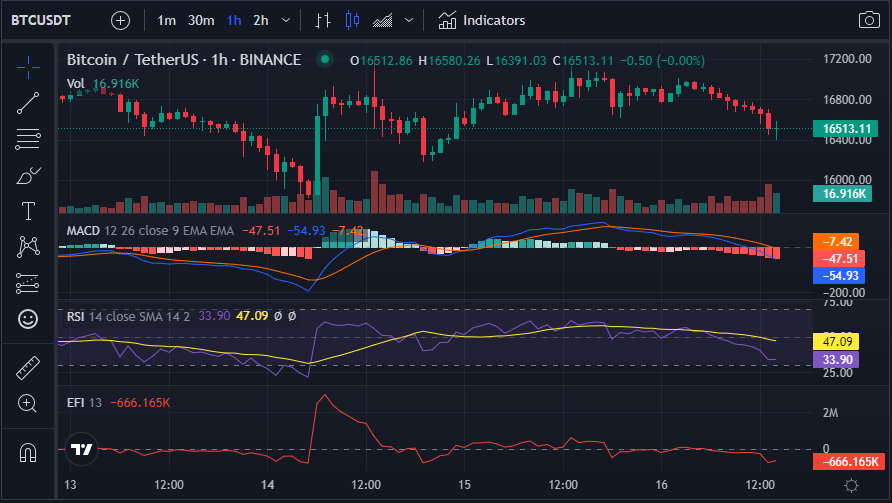
MACD in the negative territory denotes that the bears have a firmer grip on BTC prices. As of press time, the MACD blue line was moving below the signal line, with a reading of -52.55 propping up this downward trajectory. The histogram trend in the negative territory also reinforces the notion that bear dominance will continue.
On the 1-hour price chart, the Relative Strength Index (RSI) is 33.45 and points south, approaching the oversold region. This RSI trend indicates that bulls are fatigued and that bearish hegemony is expected in the near term.
When the Elder Force Index tumbles below the “0” line, bearish market sentiment is projected, as shown on the BTC chart, where the EFI is -611.755k.
If the bulls can hold the resistance level despite several indicators pointing to another bear run, the digital currency may see a bullish reversal.
Disclaimer: The views and opinions, as well as all the information shared in this price analysis, are published in good faith. Readers must do their own research and due diligence. Any action taken by the reader is strictly at their own risk, Coin Edition and its affiliates will not be held liable for any direct or indirect damage or loss.
Disclaimer: The information presented in this article is for informational and educational purposes only. The article does not constitute financial advice or advice of any kind. Coin Edition is not responsible for any losses incurred as a result of the utilization of content, products, or services mentioned. Readers are advised to exercise caution before taking any action related to the company.


