


 Price Plummets Over 5% in 24 Hours Amid Bearish Signals")
- ADA struggles with a bearish market, hovering near $0.4625 amid declining volume.
- Cardano’s market capitalization drops by 4.46%, indicating decreased activity.
- ADA’s bearish trend persists as technical indicators hint at strong selling pressure.
Cardano’s native token, ADA, experienced a marked rally in the first quarter of 2024, with its price reaching a high of $0.715 in March. Despite this surge, ADA has recently seen a loss of momentum, leading to a decline in value and a stabilization in the price range of $0.4926 to $0.4409 throughout the day. According to CoinStats data, the token hit an early intraday low but subsequently recovered slightly, stabilizing above this low point.
As of press time, ADA was trading at $0.4625, marking a 5.75% decrease over the last 24 hours. This reflects ongoing challenges for ADA as it struggles to regain its previous high values. However, compared to Bitcoin, ADA has demonstrated resilience and stability, showing a relative increase of 1.06%, which could suggest a stronger base for potential future growth.
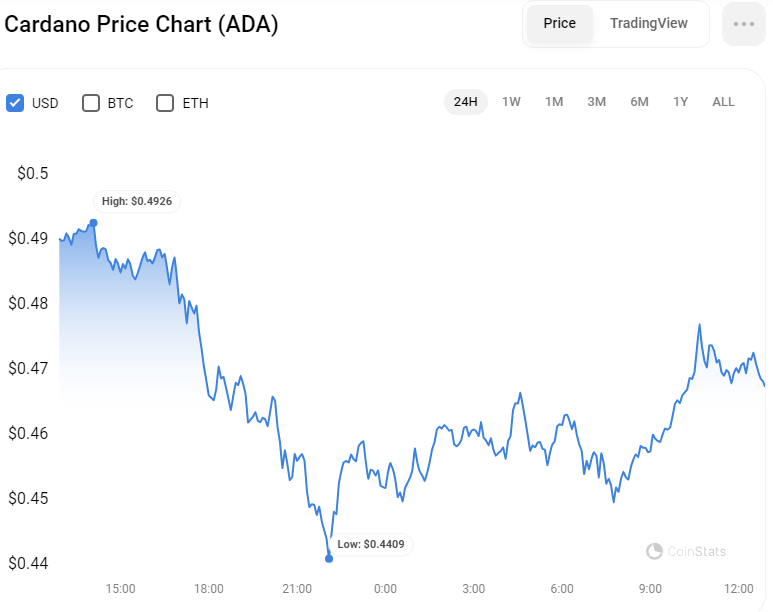
ADA/USD 24-Hour Chart (Source: CoinStats)
On the other hand, ADA’s market capitalization has experienced a downturn of 4.46% today, dropping to $16.685 billion. The trading volume for ADA has also fallen by 23.13%, landing at $647.482 million in the last 24 hours, which indicates a decrease in trading activity.
On the same accord, the trading range in which ADA is situated is serving as critical support and resistance levels. If the bearish momentum continues, ADA’s price could test the lower boundary of today’s range at $0.4409. Conversely, an upward movement would challenge the intraday high, acting as resistance.
ADA/USD Technical Analysis
The ADA token is demonstrating a bearish market structure on the one-day chart, with price action fluctuating and tending towards a downward trend since March 14. Recent developments show that after breaching a support level, the price of ADA stabilized within a new support range of $0.472 to $0.448. This stabilization suggests a possible consolidation phase, as the token resisted a further drop to lower support at $0.40, which has held firm against further declines.
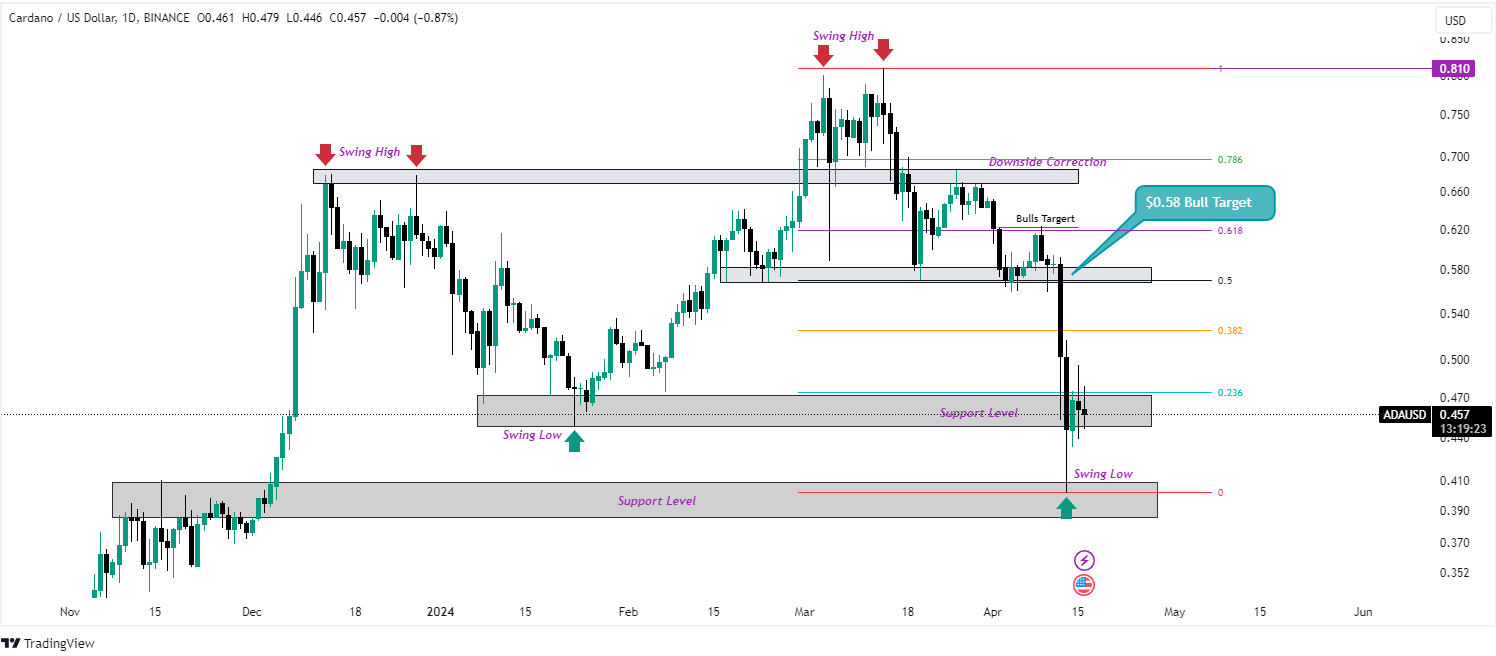
ADA/USD 1-Day Chart (Source: TradingView)
However, the market remains volatile. If a bullish trend were to take hold, ADA could potentially target the resistance zone at $0.58. This resistance is significant as it coincides with the 50% Fibonacci retracement level, calculated from a recent swing high of $0.810 to a swing low of $0.401. A breakthrough at this level could indicate a bullish trend reversal, potentially setting new targets for upward movement.
Conversely, should the price break below the current support level of $0.448, it may retest the $0.40 level, hinting at a possibility for further downward movement. This bearish sentiment is supported by key technical indicators. The Moving Average Convergence Divergence (MACD) indicator shows a sharp downward trajectory in the negative region at 0.047, indicating strong selling pressure.
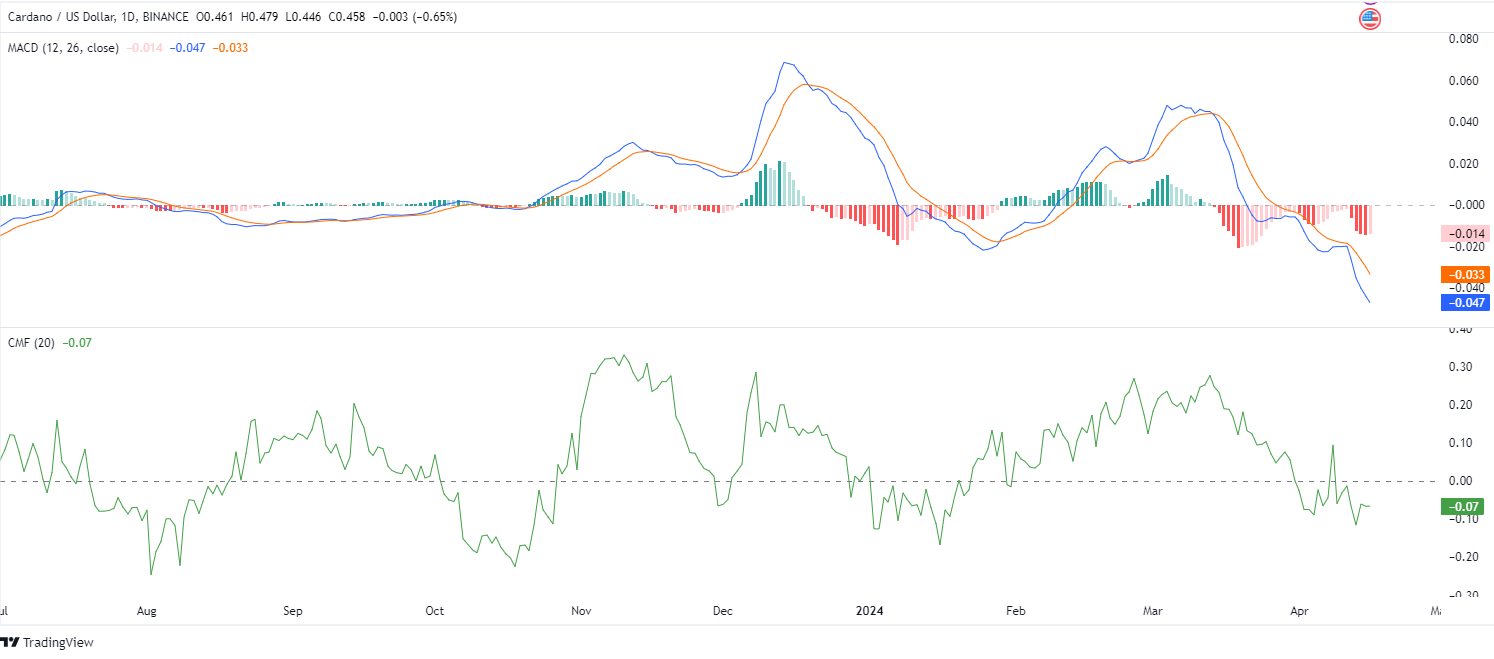
ADA/USD 1-Day Chart (Source: TradingView)
This is corroborated by the expanding red bars on the histogram below the zero line, reinforcing the potential for continued bearish trends. Additionally, the Chaikin Money Flow (CMF) indicator sits below the zero line with a reading of -0.07, suggesting a higher outflow of money from ADA compared to inflow, further supporting the prevailing bearish market sentiment.
Disclaimer: The information presented in this article is for informational and educational purposes only. The article does not constitute financial advice or advice of any kind. Coin Edition is not responsible for any losses incurred as a result of the utilization of content, products, or services mentioned. Readers are advised to exercise caution before taking any action related to the company.
 Price Prediction 2026, 2027, 2028, 2029, 2030 -2050")


