


- Chainlink price analysis indicates a bullish market sentiment.
- Chainlink broke above the previous key resistance of $8.0.
- LINK’s current resistance level is at $8.5.
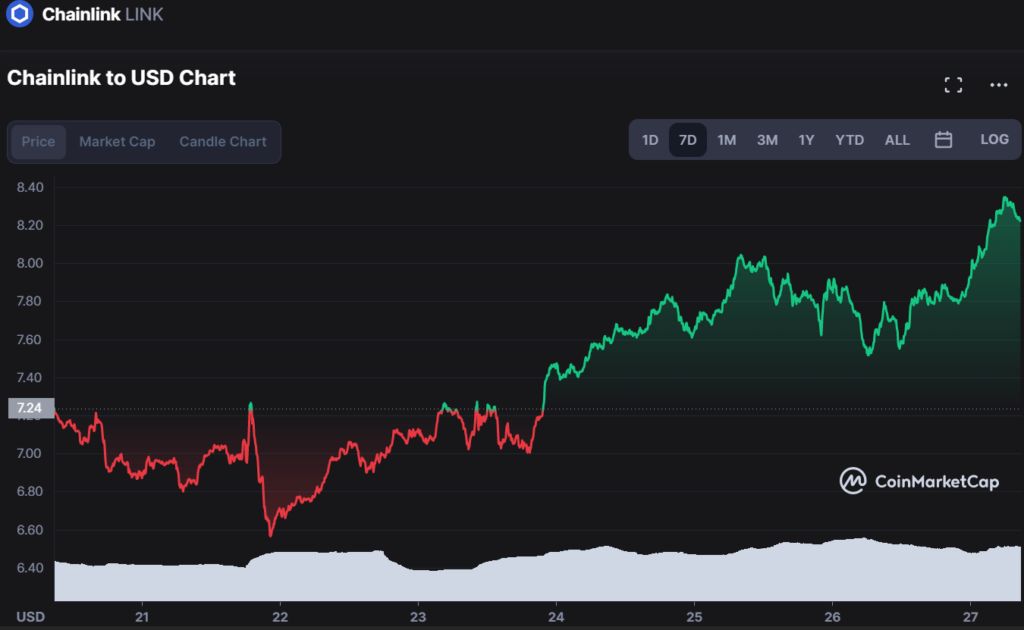
Chainlink price analysis for today shows LINK bulls were able to capture the market in the last 24 hours after a rapid price increase of over 7.22%. LINK is currently trading at $8.23.Chainlink’s intraday low was $7.55.
Chainlink’s price is currently trading above the key resistance of $8.0. The immediate support is at $8.0, which is also the 23.6% Fibonacci retracement level of the last leg from $7.55 to $8.23.Chainlink has been struggling to break higher in the last seven days and a clear uptrend was set today. The next key resistance for LINK is $8.5. In the near term, the market is poised to remain bullish as long as the price is trading above $8.0.
Looking at the daily chart, 6 clear bullish candlesticks predict an uptrend in the market. There is an ascending pattern usually seen when the market is in an uptrend. The candlesticks are well above the moving averages which indicates a high buying pressure in the market. The Bollinger bands on the daily chart are expanding, an indication of the high volatility in the market. The upper band is touching $8.35 which is the immediate resistance for the market. If the buying pressure increases, the upper band could potentially touch $8.5. The bulls will be in complete control of the market if they can push prices above $8.5 in the near term.
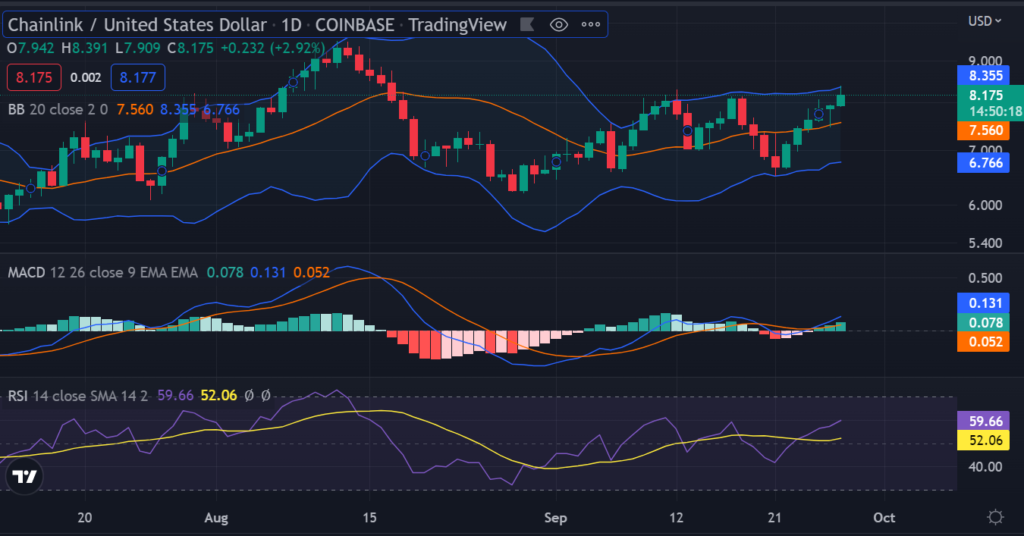
On the other hand, if the prices turn around and start trading below $8.0, it will signal a bearish trend in the market. The first support is at $7.8, which is also coinciding with the 50-day simple moving average. A break below this support level could send prices tumbling towards $7.55.
The Relative Strength Index is currently situated at 60.12 and it might reach 70 levels which is the overbought region if the buying pressure continues in the market. Moreover, the MACD line is well placed above the red signal line which is a bullish sign. On the 4-hour and hourly chart, a continuation of the bullish sentiment is clearly seen, LINK’s price is well above the 200-day and 50-day simple moving averages.
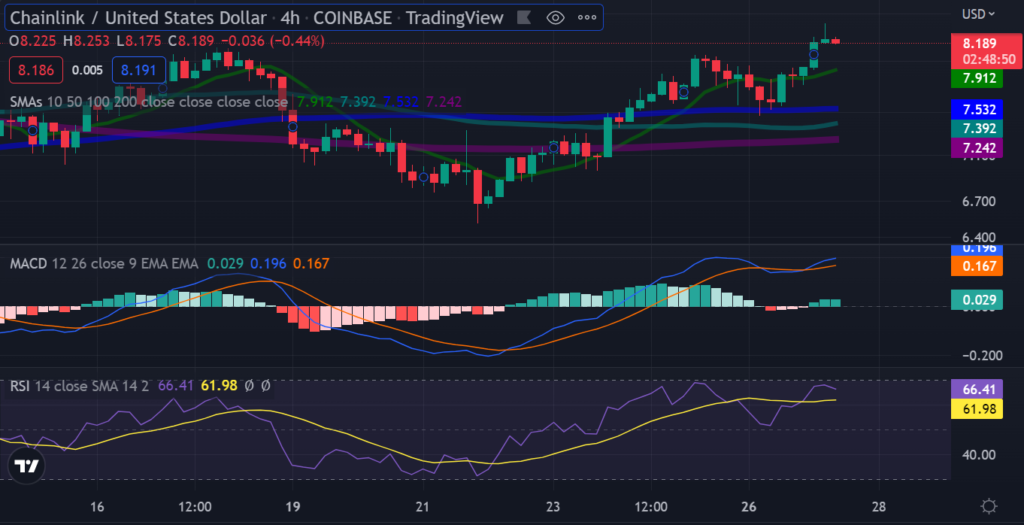
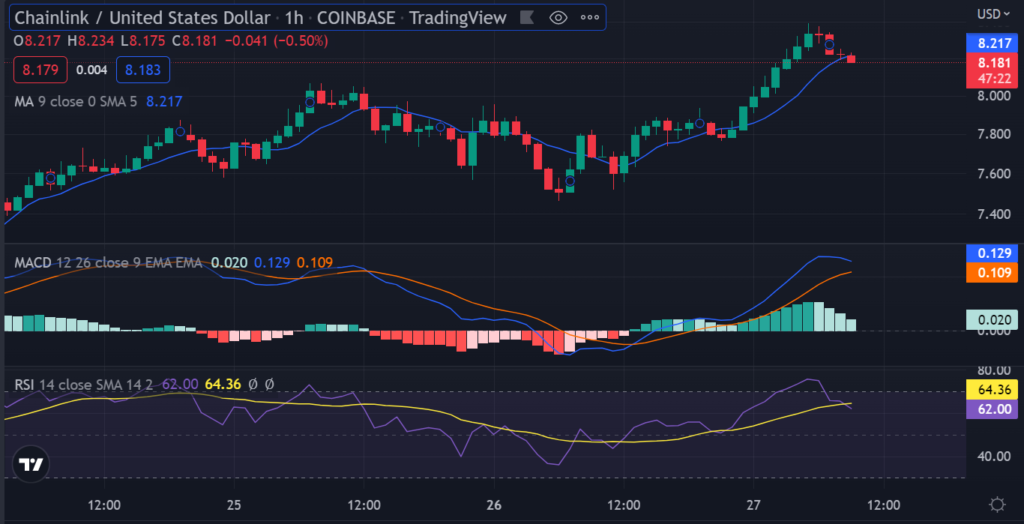
The RSI on the hourly chart is currently at 61.15, just below the overbought region which indicates that there is still some room for prices to move higher in the near term before we see a major correction. Most of the technical indicators are in favor of the bulls, however, a bearish crossover on the MACD line on the hourly chart might signal a temporary top in prices.
Overall, Chainlink is in an uptrend in the near term as long as prices are trading above $8.0.The bulls will look to push prices towards $8.5 while the bears will aim for a break below $8.0 which could take prices tumbling down to $7.55 levels. However, on the downside, we can expect some support near $7.8 levels.
Disclaimer: The views and opinions, as well as all the information shared in this price prediction, are published in good faith. Readers must do their research and due diligence. Any action taken by the reader is strictly at their own risk. Coin Edition and its affiliates will not be held liable for any direct or indirect damage or loss.
Disclaimer: The information presented in this article is for informational and educational purposes only. The article does not constitute financial advice or advice of any kind. Coin Edition is not responsible for any losses incurred as a result of the utilization of content, products, or services mentioned. Readers are advised to exercise caution before taking any action related to the company.


