 Price Prediction 2025, 2026, 2027, 2028-2030")
Conflux has entered a new phase of price expansion after breaking out from a year-long accumulation range. With the Conflux 3.0 upgrade approaching and the ecosystem positioned at the intersection of AI, real-world asset tokenization, and cross-border stablecoin settlements, the long-term trajectory for CFX has shifted significantly.
Conflux (CFX) Price Prediction Timeline 2025 – 2030
Conflux (CFX) Price Prediction 2025
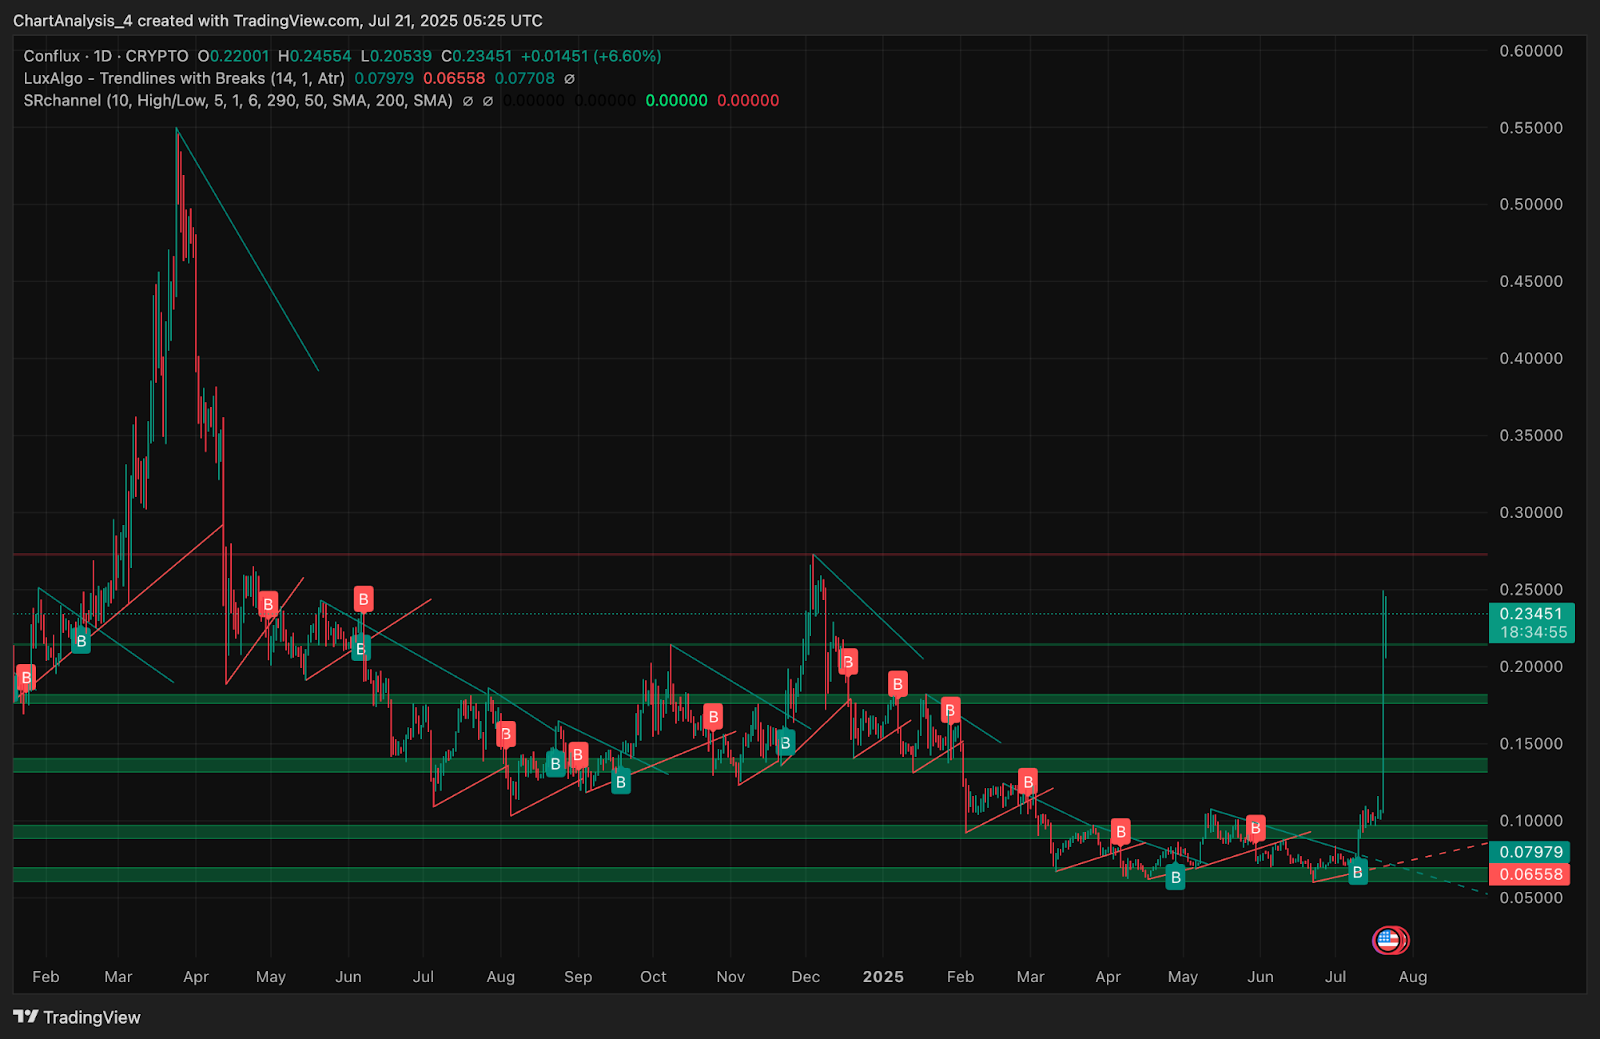
The Conflux price is currently hovering around $0.235 following an explosive rally from sub-$0.08 levels. This sharp breakout marks the first clean reversal of structure on the weekly chart in over a year. Price has reclaimed the $0.20 to $0.24 supply zone and is attempting to push through the 0.382 Fibonacci retracement level at $0.246.
A confirmed weekly close above this zone would confirm the transition from a base-building phase into a potential macro uptrend. The daily chart reflects a strong trend structure, with CFX now trading above all major moving averages.
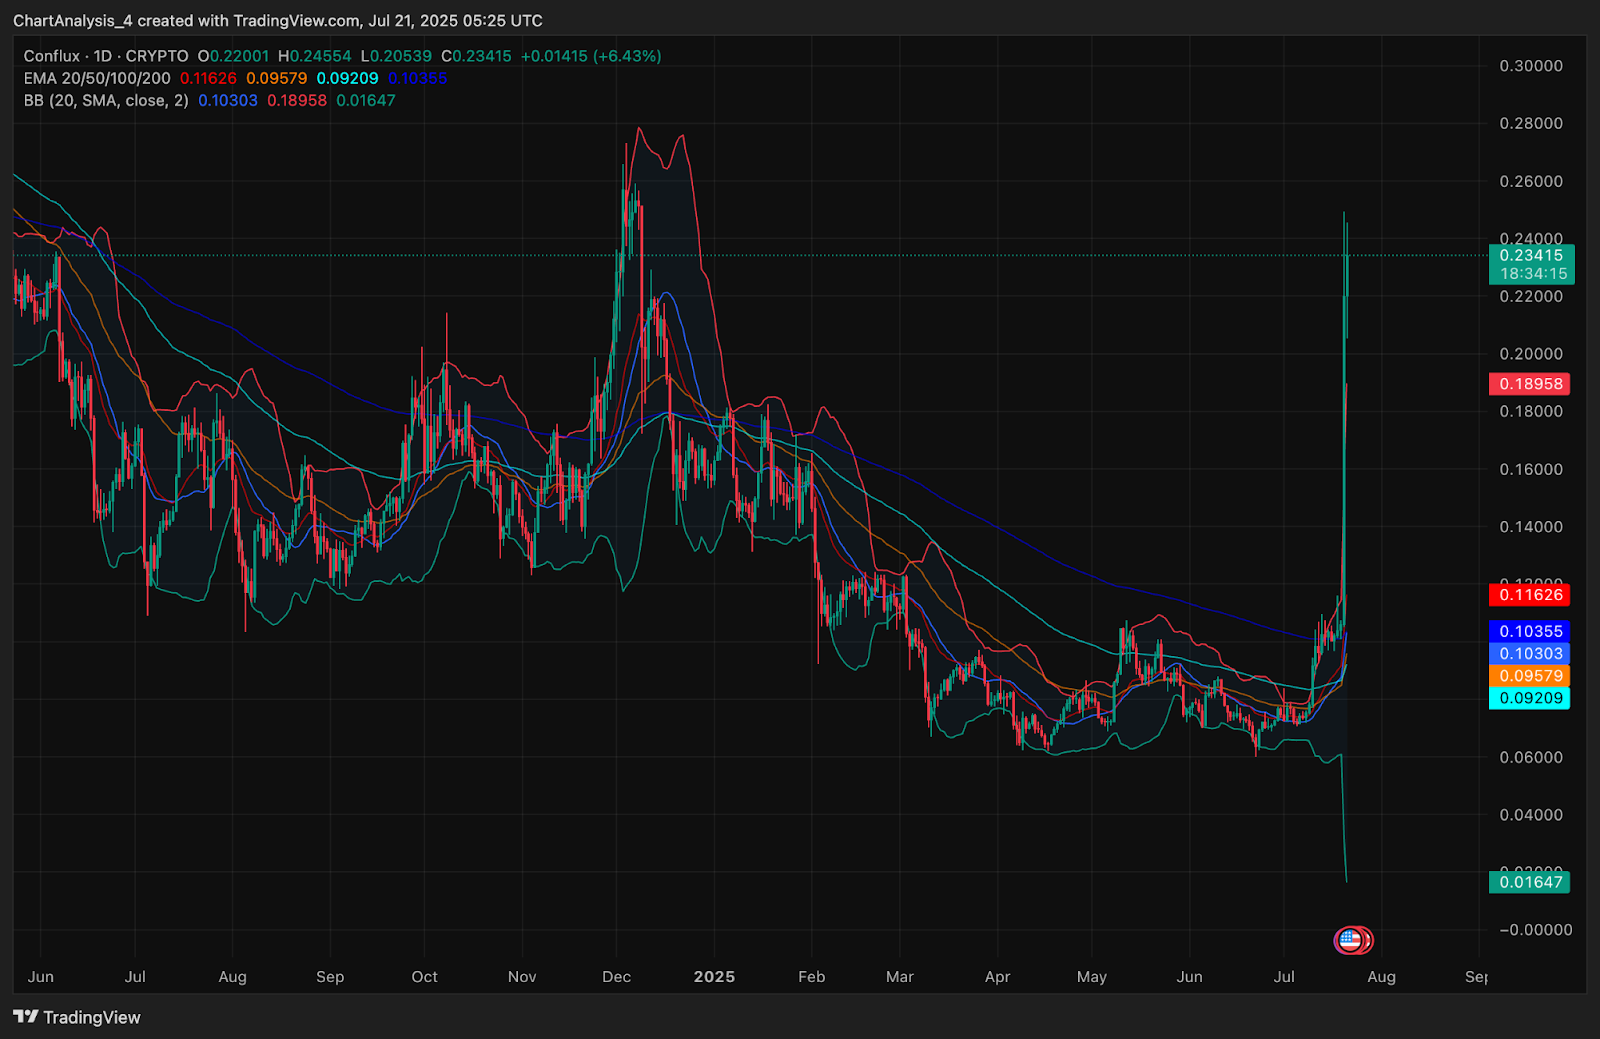
The 20, 50, 100, and 200 EMA levels have flipped to bullish alignment, while Bollinger Bands have expanded significantly, signaling the start of a volatile impulse leg. With market sentiment turning and the Conflux 3.0 upgrade scheduled for August, further price expansion remains likely this year.
Conflux (CFX) Price Analysis (Signals and indicators)
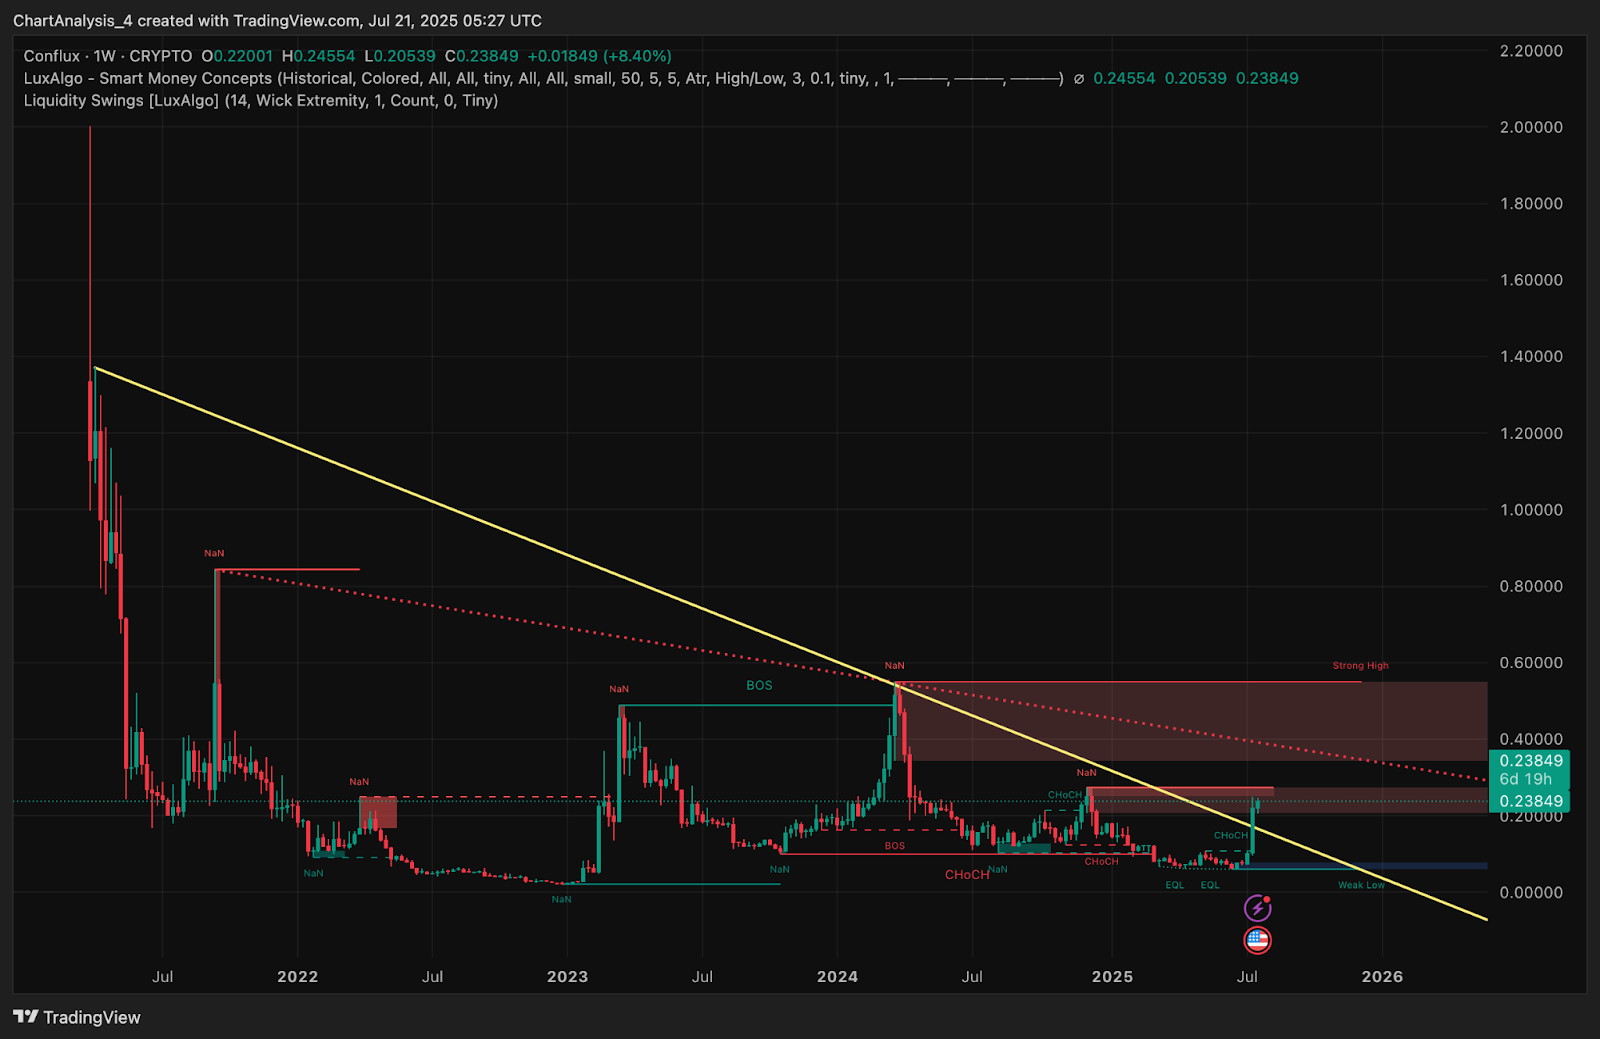
Price action over the past twelve months shows a significant transition from lower highs and breakdown structures into higher lows and continuation setups. The multi-year descending trendline has been breached, and a fresh change of character has emerged on the weekly Smart Money Concepts chart.
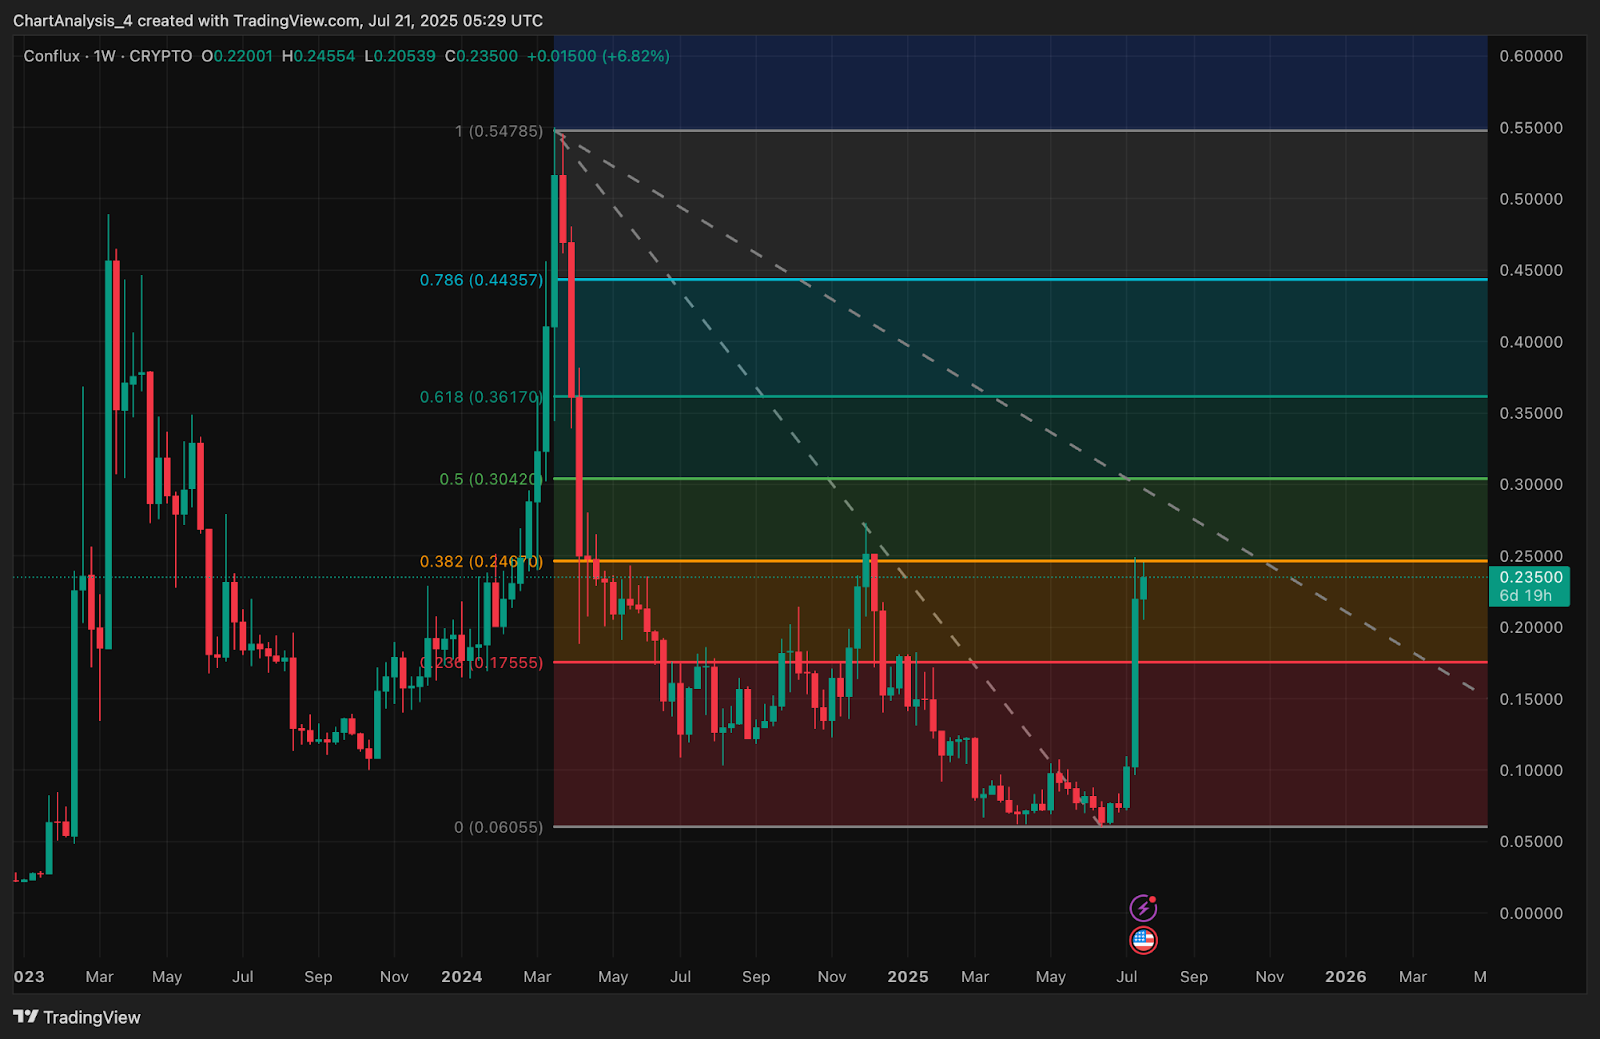
Fibonacci retracement levels place $0.30, $0.36, and $0.44 as short- to mid-term checkpoints if the rally holds above $0.25. Volume has surged dramatically, validating the recent breakout with real momentum. Technical signals across multiple timeframes now support a long-term bullish bias, provided price remains above the reclaimed trendline and the $0.18 to $0.20 range.
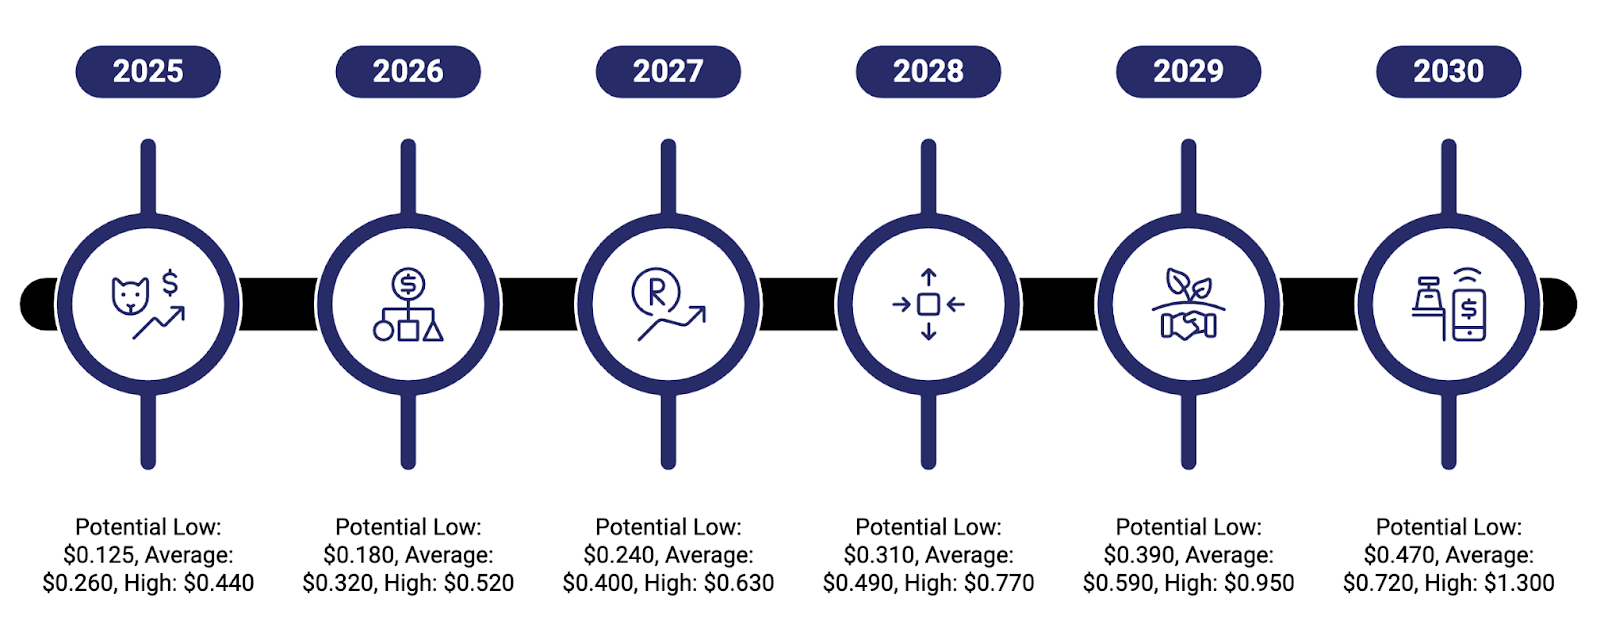
Conflux (CFX) Price Targets 2025 – 2030
| Year | Potential Low ($) | Potential Average ($) | Potential High ($) |
| 2025 | 0.125 | 0.260 | 0.440 |
| 2026 | 0.180 | 0.320 | 0.520 |
| 2027 | 0.240 | 0.400 | 0.630 |
| 2028 | 0.310 | 0.490 | 0.770 |
| 2029 | 0.390 | 0.590 | 0.950 |
| 2030 | 0.470 | 0.720 | 1.300 |
Conflux (CFX) Price Prediction 2026
The year 2026 may serve as the expansion phase for CFX if the network successfully deploys its Tree-Graph upgrade and attracts real-world adoption. Stablecoin use cases and high-throughput AI-enhanced smart contracts could help the asset sustain its rise into the $0.30 to $0.52 range. Price structure will likely shift into a higher channel, with support forming around $0.24 and potential for continued rallies if market conditions remain favorable.
Conflux (CFX) Price Prediction 2027
By 2027, the impact of tokenized real-world assets and offshore stablecoin applications could begin reflecting in Conflux’s valuation. With network architecture supporting 15,000 transactions per second and the RMB-backed stablecoin narrative gaining attention, CFX could approach the $0.63 mark. Liquidity rotation from larger assets into high-utility layer-1 chains may further support upward price momentum.
Conflux (CFX) Price Prediction 2028
If global demand for programmable digital assets accelerates, Conflux could benefit as a high-speed settlement layer for Web3 financial activity. The platform’s emphasis on cross-border infrastructure and stablecoin rails may support its expansion toward the $0.77 level. Investor attention may increasingly turn toward fundamentally sound ecosystems that integrate AI, RWA, and scalability, giving Conflux a long-term edge.
Conflux (CFX) Price Prediction 2029
In 2029, a potential macro top in the crypto market cycle could coincide with Conflux testing the $0.95 level. This would represent a 4x to 5x return from its 2025 average, driven by ecosystem maturity, integrations across real economy verticals, and institutional participation. If previous Fibonacci ceilings at $0.44 and $0.55 are reclaimed convincingly, price could push into the final accumulation phase before entering a new expansion wave.
Conflux (CFX) Price Prediction 2030
Conflux could enter price discovery in 2030 if the network becomes a central piece of Asia’s digital trade infrastructure. With throughput exceeding 15,000 TPS, full integration of on-chain AI services, and a leading role in RMB-denominated stablecoin deployment, price may advance toward the $1.30 mark. The asset could find an average value near $0.72, with accumulation zones between $0.60 and $0.90 acting as structural support. A speculative rally at the top of the cycle may drive the asset into uncharted territory.
Conclusion
Conflux has moved from a prolonged consolidation into a decisive breakout phase, reclaiming structural levels last seen over a year ago. With the Tree-Graph upgrade, rising institutional interest, and a growing footprint in the stablecoin economy, CFX is now building the foundation for long-term upside. As price holds above reclaimed zones and volume sustains momentum, the coming years may see a revaluation that pushes CFX beyond $1.00, offering new opportunities for both traders and long-term holders into 2030.
Disclaimer: The information presented in this article is for informational and educational purposes only. The article does not constitute financial advice or advice of any kind. Coin Edition is not responsible for any losses incurred as a result of the utilization of content, products, or services mentioned. Readers are advised to exercise caution before taking any action related to the company.
 Price Prediction: UNI Eyes $5 as UNI Extends Bullish Breakout")


