


- Crypto market analyst Tara tweeted that XRP was on its way to form double-tops.
- XRP makes lower highs in the first double-top and higher-highs in the second double-top.
- A broken Adam and Eve pattern could present an opportunity for short-entry traders.
Crypto Market Analyst and Investor Tara tweeted that XRP was going to form double tops (M- Pattern) approximately at $0.435 simultaneously when Bitcoin hit 24.2K.
When closely considering the image shared on the tweet, Tara makes a comparison of the two consecutive XRP-double tops. The left shoulder of the first double top pattern marked as four on the tweet is higher than the right shoulder marked as five. Moreover, the neckline is lower than both arms, marked as three and two on the tweet.
As XRP registered a lower high with its right shoulder, the Quasimodo pattern, which identifies trend reversals, denotes that XRP is bearish. However, when considering the second double top, XRP is making higher highs, as its right shoulder is higher than its left. This denotes a bullish trend.
Meanwhile, XRP has been trading in the green zone throughout the previous week, as shown below. When the markets opened for trading, the token was priced at $0.384. Although during the course of the first day, XRP rose abruptly, the next two days were followed by consolidation after reaching $0.41.
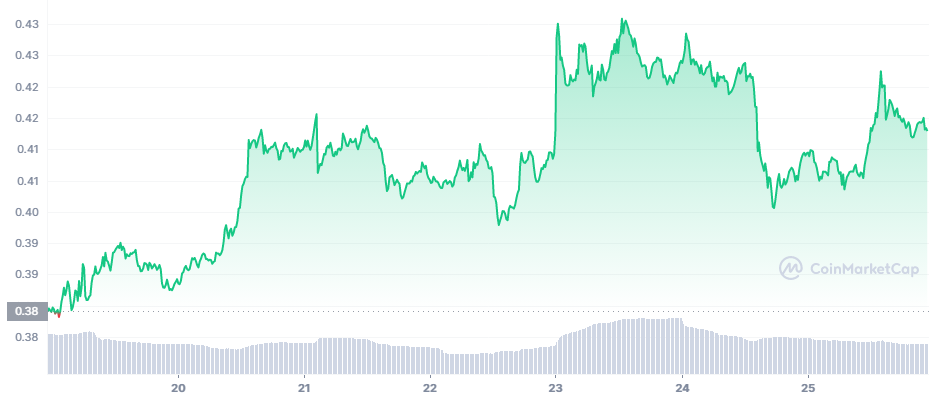
However, late into day three, the bulls pushed the prices up to $0.43 from $0.41. During this rally, XRP reached its maximum price of $0.4309 on the fourth day. Nonetheless, the bulls lost control of XRP, and the prices tanked from $0.4238 to $0.4008 within a few hours. Currently, XRP is up 1.15% in the last 24 hours and is priced at $0.4133.
As shown in the chart below, XRP fluctuated, forming the Adam and Eve pattern. Traders should be vigilant since if, by any chance, the pattern is to be dismantled; then traders should consider a short entry to leverage on the opportunity. A trader could sell the asset higher and buy it back at a lower cost.
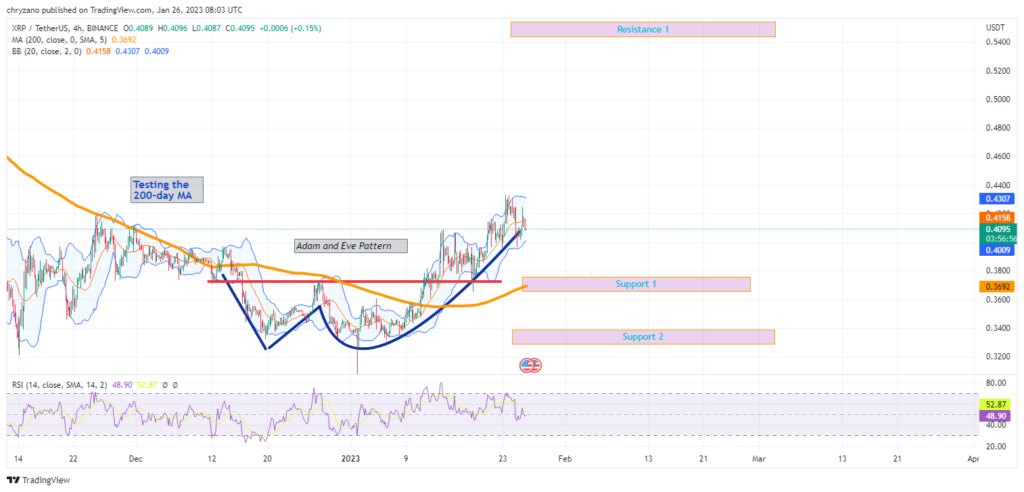
And for those going long, the time frame for them to wait for a surge could increase as XRP seems to be moving sideways. The Bollinger bands, too, second this sentiment, as they are placed parallel to the horizontal axis.
Moreover, the RSI is at 48.90. Since the RSI is not oversold or overbought, XRP could move either way. If the XRP keeps its shape and builds on the Adam and Eve pattern, it could surge to resistance 1. However, if the shape is broken, XRP could tank to support 1, which seems to be a formidable territory as the 200-day MA is too present there.
But if by any means the bears are strong enough to push XRP below the 200-day MA, then it would land on support 2, which overlaps with Adam and Eve’s bottom.
Disclaimer: The views and opinions, as well as all the information shared in this price analysis, are published in good faith. Readers must do their own research and due diligence. Any action taken by the reader is strictly at their own risk, Coin Edition and its affiliates will not be held liable for any direct or indirect damage or loss.
Disclaimer: The information presented in this article is for informational and educational purposes only. The article does not constitute financial advice or advice of any kind. Coin Edition is not responsible for any losses incurred as a result of the utilization of content, products, or services mentioned. Readers are advised to exercise caution before taking any action related to the company.
 Price Prediction 2026, 2027, 2028, 2029, 2030-2050")
 Price Prediction 2026, 2027, 2028, 2029, 2030-2050")


