


- SOL, XRP, and GAL emerged as some of the top performers in the market in terms of 24-hour gains.
- SOL may look to overcome the negative trend line that had formed on its daily chart over the past few weeks.
- A medium-term bullish technical flag was triggered on GAL’s chart which may lead to it climbing to $1.4510.
Solana (SOL), Ripple (XRP), and Galxe (GAL) emerged as some of the top performers in the market throughout the past day of trading. During this same period, the total market cap of the cryptocurrency market increased by 0.62%, according to CoinMarketCap. Despite this increase, investors were not able to reach a consensus regarding which way prices should move.
Solana (SOL)
SOL was able to achieve a 24-hour gain of 0.16%. This positive performance added to its weekly performance as well, pushing the altcoin’s weekly streak to +11.14%. As a result of the latest price movement, the altcoin was changing hands at $19.87 at press time.
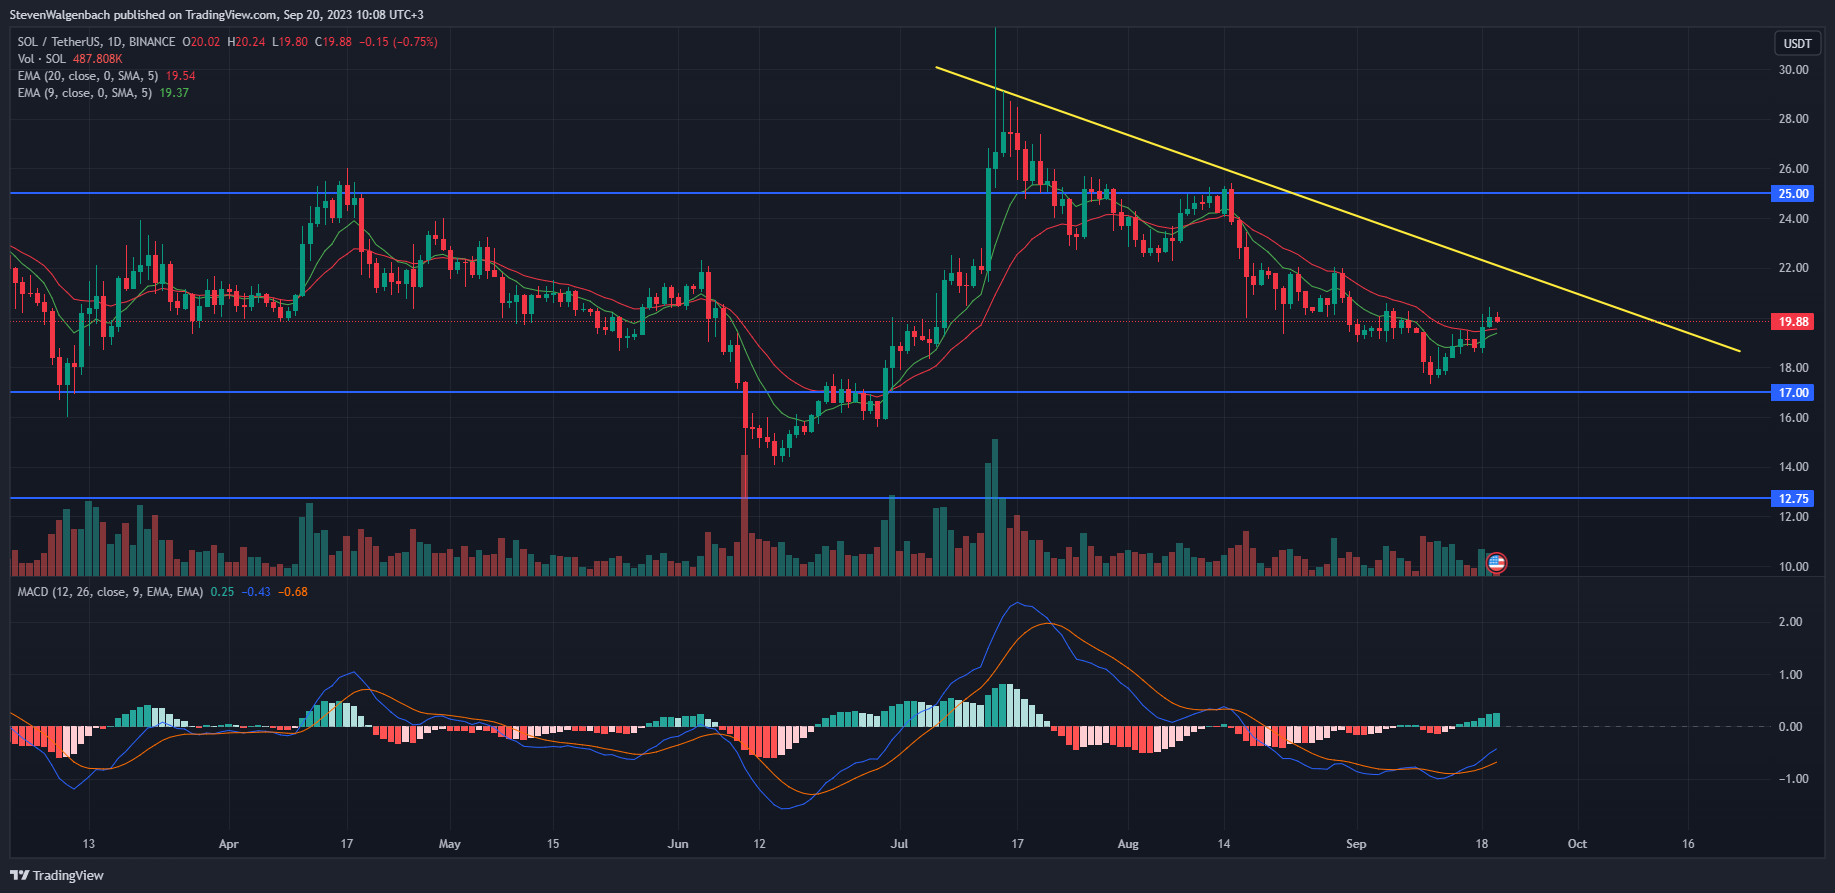
From a technical perspective, SOL was able to break above both the 9-day and 20-day EMA lines over the past 48 hours and continued to trade above these two technical indicators. Should this bullish momentum continue, SOL may attempt to break above the medium-term negative trend line that had been established on its daily chart throughout the past few weeks.
Thereafter, the altcoin’s price will have a clear path to rise to the next barrier at $25. This bullish thesis will be invalidated if SOL’s price closes a daily candle below the 9-day EMA line at around $19.37 within the next 48 hours. In this scenario, SOL’s price may drop to the immediate support level of $17 in the following couple of days.
If the sell volume persists, then SOL may drop below this mark and potentially drop to $12.75. A bullish move may be more likely to occur in the coming couple of days given the presence of numerous bullish technical flags that were present on the altcoin’s daily chart.
Firstly, the daily MACD line had crossed above the daily MACD signal line throughout the past 7 days. This could suggest that SOL’s negative trend has undergone a bullish reversal recently. Another technical indicator that suggests SOL’s price may continue to rise in the coming few days is the daily MACD Histogram, which has gradually risen over the past three days. This suggested that the bullish trend may continue.
In addition to this, a significant bullish technical flag was on the verge of being triggered on SOL’s daily chart. At press time, the 9-day EMA line was attempting to cross above the 20-day EMA line. If these 2 technical indicators cross, it could signal that short-term momentum has shifted more in favor of bulls.
Ripple (XRP)
The remittance token saw its price rise 1.62% throughout the past day of trading. Notably, this was also the 2nd biggest daily gain printed in the top 10 list — ranking XRP one position behind Toncoin (TON) which experienced a 2.60% uptick during the same period. Subsequently, XRP’s price stood at $0.515 at press time.
The total trading volume for XRP also increased over the past 24 hours. CoinMarketCap data indicated that the altcoin’s daily trading volume was up 0.34%. As a result, the total trading volume stood at just over $1.015 billion.
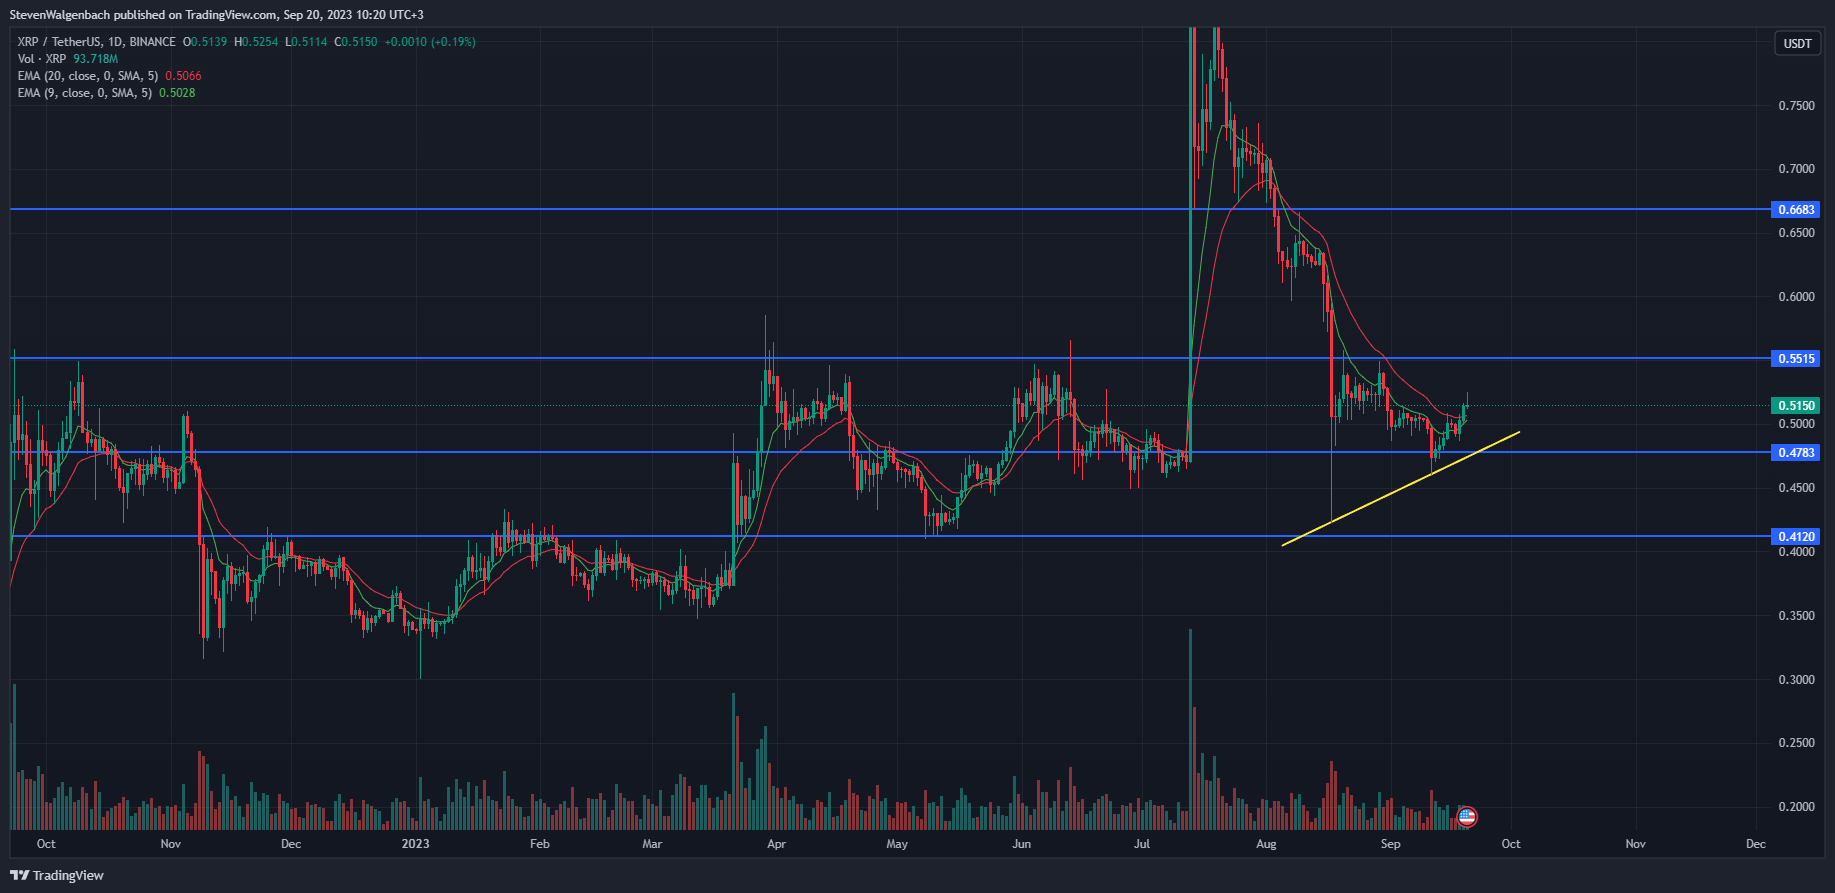
A positive trend line had formed on XRP’s daily chart over the past few weeks after the cryptocurrency’s price printed a second higher low during this period. This bullish momentum continued, allowing XRP to break above the $0.4783 mark as well as the 9-day and 20-day EMA lines, where it continued to trade at press time.
Similar to SOL, the 9-day EMA line was attempting to cross above the 20-day EMA line on XRP’s daily chart. These two lines crossing in the next 24-48 hours may boost XRP’s price to cross above the $0.551 resistance level and may even give the cryptocurrency’s price the support needed to attempt a challenge at $0.6683 as well.
On the other hand, a break below the previously breached $0.4783 price point will also result in XRP breaking below the positive trend line that had formed on its daily chart. Consequently, XRP may be at risk of dropping to the next major support level at $0.4120 in the following week.
Galxe (GAL)
GAL led the way in terms of gains as its price increased a remarkable 6.96% during the past 24 hours. As a result, GAL’s price stood at $1.30, which was slightly closer to its 24-hour low of $1.21 than its peak for the same period, which stood at $1.41. Along with the impressive price performance, GAL’s trading volume also surged more than 400%.

GAL was attempting to challenge the key resistance level at $1.3350 at press time. It was able to break above this barrier during yesterday’s trading session, but sellers were quick to act, resulting in GAL closing yesterday’s trading session back below this noteworthy price point.
Technical indicators suggested that GAL may break above $1.3350 again within the next 24-48 hours. For instance, the 20-day EMA line crossed above the 50-day EMA line earlier, which could be a signal that the medium-term momentum has shifted in favor of buyers.
If this technical flag is validated in the coming few days, then GAL’s price may rise to as high as $1.4510 within the next 2 weeks. This bullish thesis will be invalidated if GAL’s price breaks below $1.2250 over the course of the upcoming couple of days.
Not only is this level confluent with the 50-day EMA line, but is also around the same level as the 9 and 20 EMA lines on GAL’s daily chart as well. Therefore, a break below this point may be followed by a steep price drop to the crucial support level of $1.0830.
Disclaimer: The views and opinions, as well as all the information shared in this price analysis, are published in good faith. Readers must do their own research and due diligence. Any action taken by the reader is strictly at their own risk. Coin Edition and its affiliates will not be held liable for any direct or indirect damage or loss.
Disclaimer: The information presented in this article is for informational and educational purposes only. The article does not constitute financial advice or advice of any kind. Coin Edition is not responsible for any losses incurred as a result of the utilization of content, products, or services mentioned. Readers are advised to exercise caution before taking any action related to the company.
 Price Prediction 2026, 2027, 2028, 2029, 2030 -2050")


