


- Market indicators suggest potential oversold conditions for BONK, WIF, PEPE, and FLOKI.
- Traders should exercise caution and seek additional confirmations before acting on potential buying opportunities.
- The bearish momentum indicated by MACD and RSI underscores market volatility and uncertainty.
The cryptocurrency markets have been through a remarkable turbulence that has sent token prices such as BONK to a downside in the last 24 hours. This adjustment has emitted a doubtful question in the mind of investors whether current loss is temporary or the beginning of a more sustained downward trend.
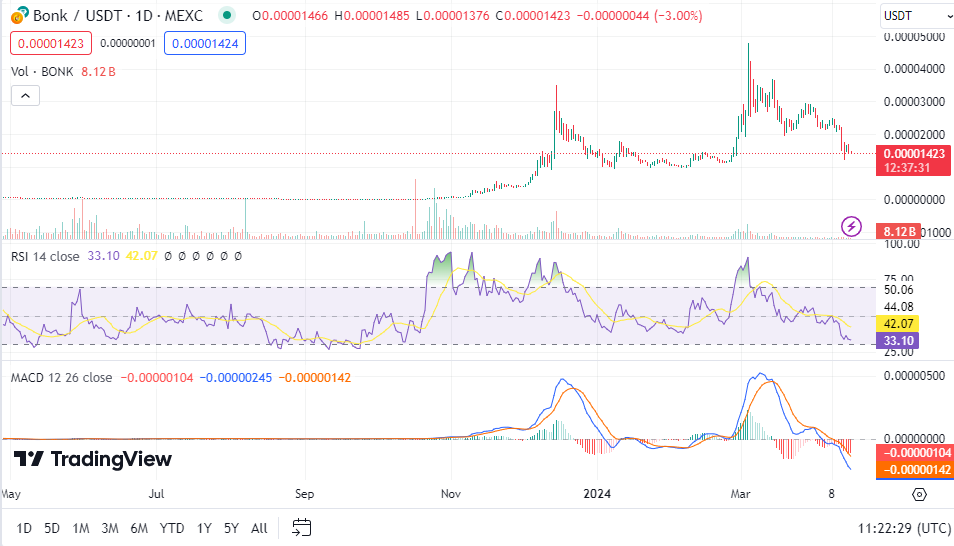
BONK/USD 1-Day price chart (Source: Trading view)
BONK, at the price of $0.000014 has dropped in value by 16.74% in the last 24 hours. The RSI of BONK is at 33.01, showing that the asset is on the verge of being oversold by the indicator. Additionally, the MACD indicator shows a bearish trend in the short term, with the MACD line trading below the signal line.
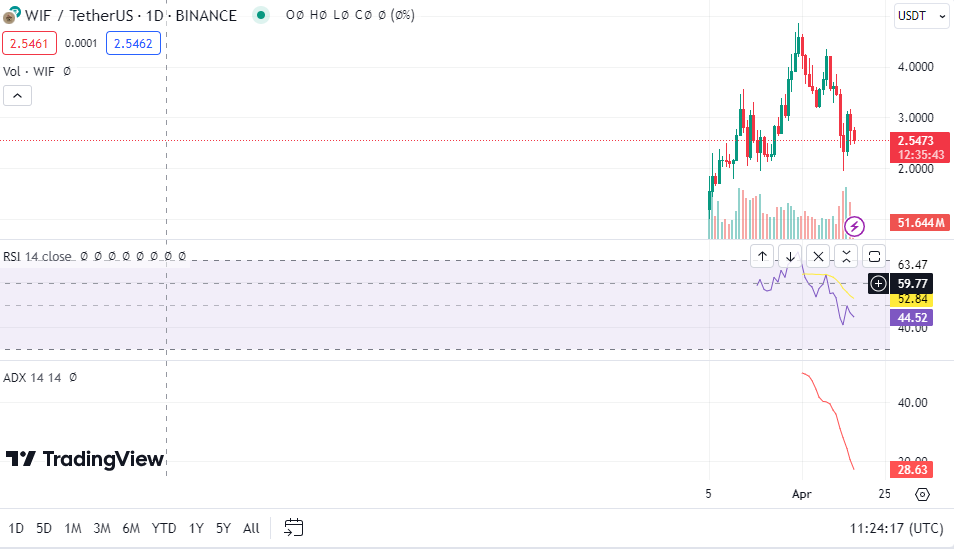
WIF/USD 1-Day price chart, Source: Trading view
While WIF price plummeted by 16.64% based on the latest Coinmarket data and $2.54 per token, the RSI for WIF was reported at 44.37 which suggests that WIF price is approaching the oversold situation and represents a possible buying time.
The MACD trading below the signal line reinforces a bearish sentiment in the near term, although traders are advised to watch for a potential bullish signal if the MACD line crosses above the signal line.
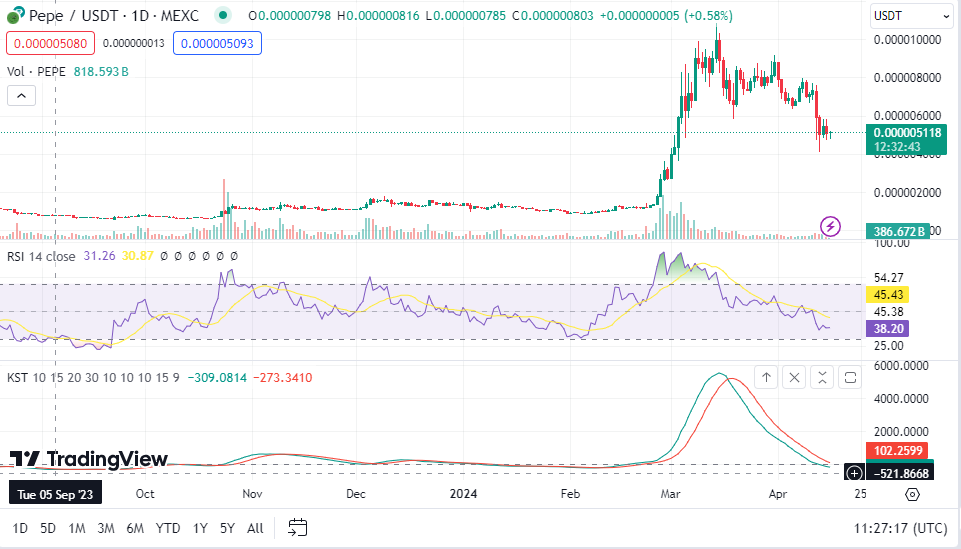
PEPE/USD 1-Day price chart (Source: Trading view)
PEPE, another token in the spotlight, has dropped 10.75% to $0.000005. Its RSI of 38.19 suggests that it is approaching oversold conditions, potentially signaling a short-term buying opportunity. However, given the bearish momentum indicated by the MACD and KST (Know Sure Thing) indicators, traders are cautioned to seek confirmation from other technical indicators before making decisions.
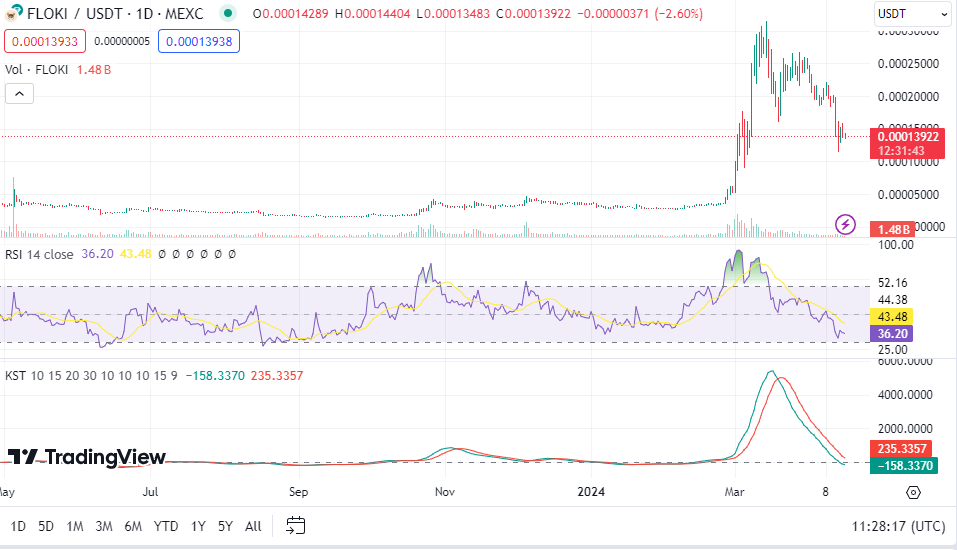
FLOKI/USD 1-Day price chart (Source: Trading view)
FLOKI, now at 0.000138 is down 12.10% in the last 24 hours. Its RSI of 36.40 indicates potentially oversold conditions and also hints at a buying opportunity for traders entering the market. The MACD and KST indicators both support a bearish trend in the short term for FLOKI.
Disclaimer: The information presented in this article is for informational and educational purposes only. The article does not constitute financial advice or advice of any kind. Coin Edition is not responsible for any losses incurred as a result of the utilization of content, products, or services mentioned. Readers are advised to exercise caution before taking any action related to the company.


