


- Recent price analysis reveals a bearish trend in DOGE price.
- Bulls must fight on if the downward trend in DOGE is to be reversed.
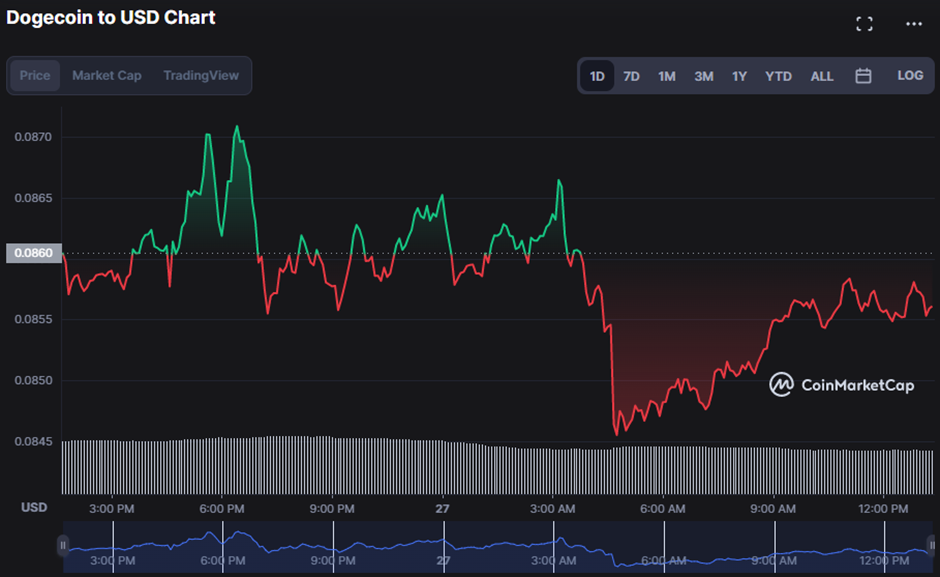
- DOGE market finds support at $0.08452 during the downturn.
Bullish momentum in Dogecoin (DOGE) markets was stifled by resistance at the day’s high of $0.08715. Due to this setback, the bears gained control of the market and pushed prices down until they found support at the $0.08452 level. Due to this negative trend, the price of DOGE has dropped by 0.35%, to $0.08544, as of this writing.
Market capitalization and 24-hour trading volume both dropped by 19.49% to $406,272,738 and 20.09% to $404,103,786 as investors fled the market in anticipation of further price declines.
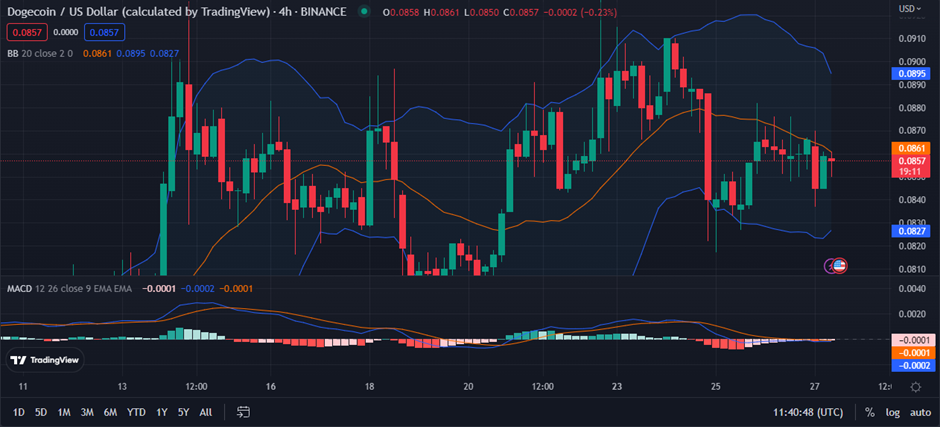
On the DOGE 4-hour price chart, the Bollinger Bands are contracting, with the upper band at $0.0895 and the lower band at $0.0826. This indicates that DOGE is on the decline and may continue to tumble in the short term. However, if there is a sudden surge in buying activity and the price breaks out above the upper Bollinger Band, a bullish burst may emerge.
The blue MACD line is trending in the negative sector with a value of -0.0002, indicating that the bears’ hold on the DOGE market may continue. This negative sentiment is reinforced by the histogram’s tendency in the negative zone. If the bulls do not intervene, the price may fall further toward the $0.08452 support level.
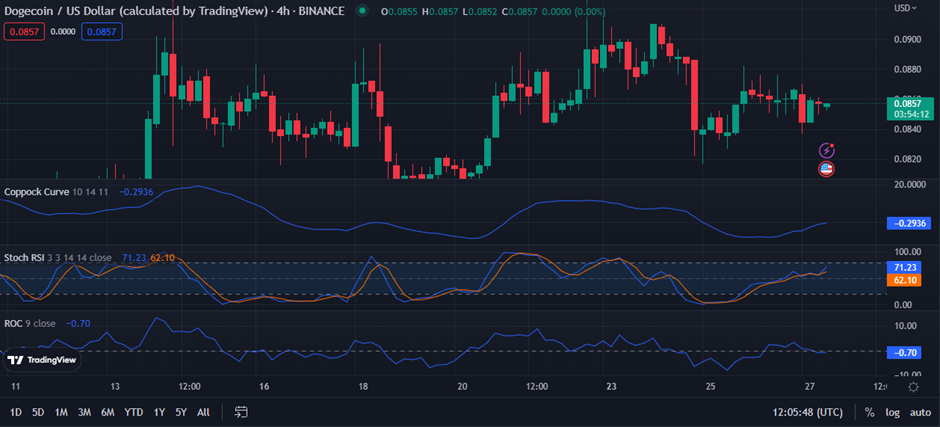
A Coppock Curve of -1.1675 indicates a bleak market picture in the near future. The current spike, however, suggests that markets are gradually rebounding, which might indicate a change in market mood. If the bull continues to fight and break the bear’s grip, this pattern forecasts a near-term comeback.
However, the ROC score of -1.27 reveals a downward trend in the DOGE price chart. This action suggests that the market’s downward trend will likely continue for the foreseeable future, predicting more price declines and dashing hopes of a rebound.
Currently, the stochastic RSI is at 71.23, which suggests a possible reversal after recently crossing above the signal line. In the event that this trend continues, the market may become overbought, setting the stage for a possible reversal in the near future.
If bulls can keep pushing the price above resistance, technical indications predict a market correction to the upside.
Disclaimer: The views and opinions, as well as all the information shared in this price analysis, are published in good faith. Readers must do their own research and due diligence. Any action taken by the reader is strictly at their own risk, Coin Edition and its affiliates will not be held liable for any direct or indirect damage or loss.
Disclaimer: The information presented in this article is for informational and educational purposes only. The article does not constitute financial advice or advice of any kind. Coin Edition is not responsible for any losses incurred as a result of the utilization of content, products, or services mentioned. Readers are advised to exercise caution before taking any action related to the company.


