


- Crypto Tony revealed in an X post that DOGE was able to escape a bearish pattern on its weekly chart.
- According to the post, DOGE maintaining a position above this pattern may lead to a meme coin rally in the next few weeks.
- At press time, DOGE was trading hands at $0.06885 following a 1.76% 24-hour gain.
The cryptocurrency trader and analyst Crypto Tony revealed in an X post yesterday that Dogecoin (DOGE) is retesting the upper level of a long-term descending triangle on its weekly chart. In the post, the analyst stated that DOGE maintaining a position above the bearish chart pattern for the next few weeks could lead to a strong pump for meme coins.
The collective market capitalization for meme coins rose 3.04% over the past 24 hours, according to data from CoinMarketCap. This positive performance coincided with the rise seen in the broader market’s cap of 2.51% during the same period. Subsequently, the meme coin market was valued at $16,375,551,902.
The leading meme coin, DOGE, was able to post a 24-hour gain of 1.76%. This recent price increase was also enough to boost DOGE’s weekly performance out of the red zone to +0.08%. As a result, the cryptocurrency’s price stood at $0.06885 at press time.
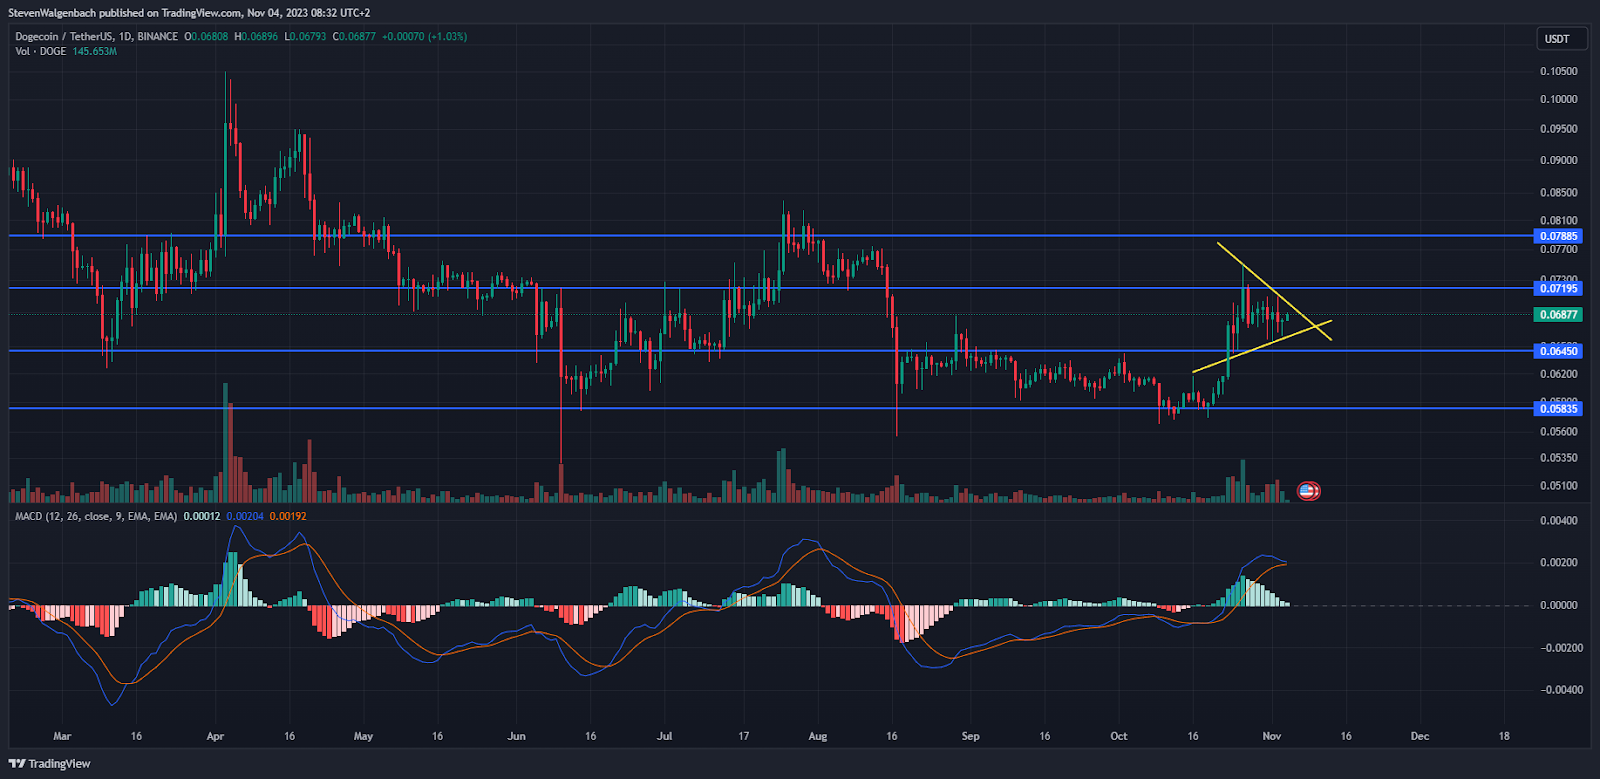
A symmetrical triangle had formed on DOGE’s daily chart over the past few days. This specific pattern suggests that the cryptocurrency may breakout in the next few days. Should this breakout be towards the upside, then DOGE may attempt to overcome the $0.07195 resistance level. Thereafter, continued buy pressure could elevate DOGE to as high as $0.07885.
On the other hand, a negative breakout could see DOGE retest the immediate support level at $0.06450 in the following 24-48 hours. Sellers could then push the meme coin’s price to the next key level at $0.05835 in the short term.
Traders and investors will want to take note of the fact that the daily Moving Average Convergence Divergence (MACD) indicator was on the verge of triggering a significant bearish technical flag. At press time, the MACD line was looking to cross below the MACD Signal line, which could suggest a continuation of DOGE’s bearish trend may take place.
Disclaimer: The information presented in this article is for informational and educational purposes only. The article does not constitute financial advice or advice of any kind. Coin Edition is not responsible for any losses incurred as a result of the utilization of content, products, or services mentioned. Readers are advised to exercise caution before taking any action related to the company.


