
- Dogecoin briefly tested the support at $0.068 yesterday.
- The bulls are now pushing for further gains after breaking out of the wedge pattern.
- Dogecoin could test the immediate resistance area of $0.077.
Dogecoin (DOGE), the world’s first meme-based cryptocurrency, has been on a stunning rally since mid-November. In the past 24 hours, DOGE is up by around 1.75%, which led its price to jump from $0.0692 to $0.07348. DOGE fell below the key support of $0.70 yesterday, but the bulls have been able to push back and take DOGE above this level.
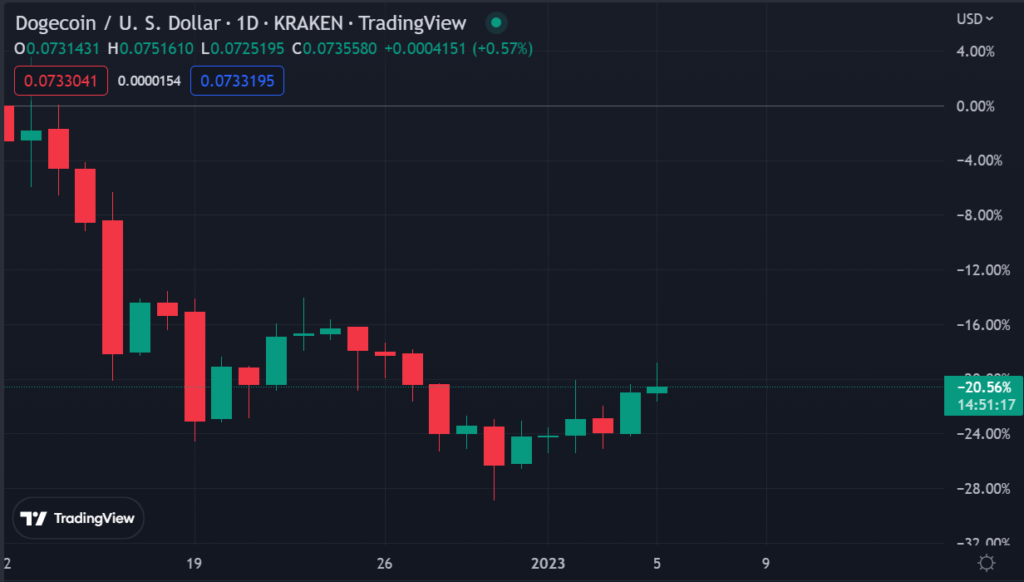
The daily chart for DOGE indicates the meme coin is trading above the 50-day moving average. DOGE price also has tested and retested the wedge pattern several times over the past few days, indicating a bullish breakout is in play.
In addition, the MACD indicator is on a bullish run, with its signal line trending above zero. This indicates that Dogecoin buyers have the upper hand in terms of momentum.
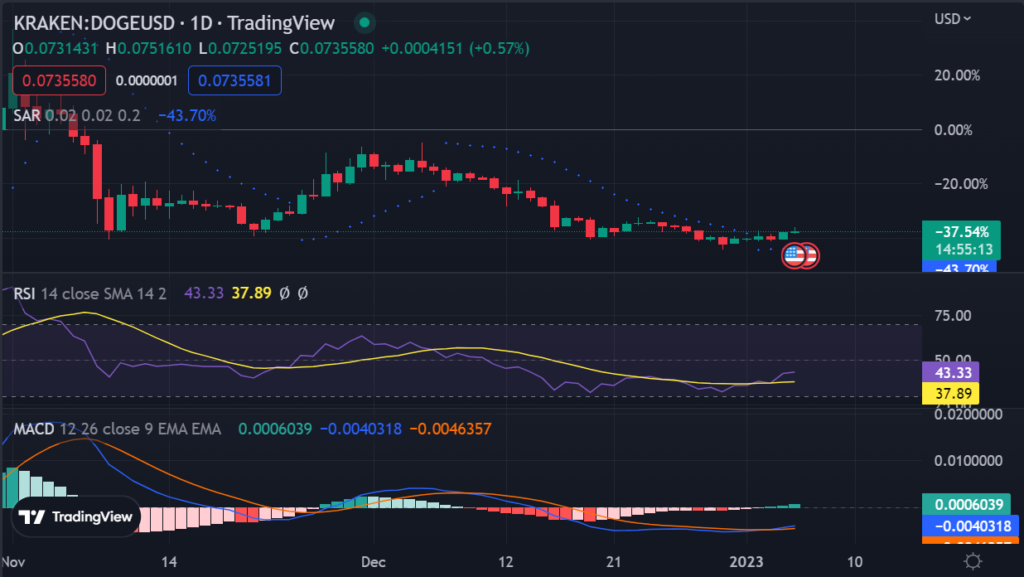
If the bulls remain in control, Dogecoin could retest the immediate resistance area of $0.077, which is around 8% higher than today’s price. A breakout above this level could lead to fresh highs for Dogecoin in the coming days. Further gains can be expected if DOGE is able to sustain above the wedge pattern.
On the downside, if Dogecoin prices continue to fall, then the immediate support level is at $0.071. If this support level fails to hold, then DOGE could see a deeper correction toward the next major support area of $0.056.
Dogecoin price analysis on a 4-hour chart shows a bullish breakout from the wedge pattern. The MACD indicator is also on a bullish run, suggesting further gains in DOGE prices. However, any further dips should be monitored for possible buying opportunities.
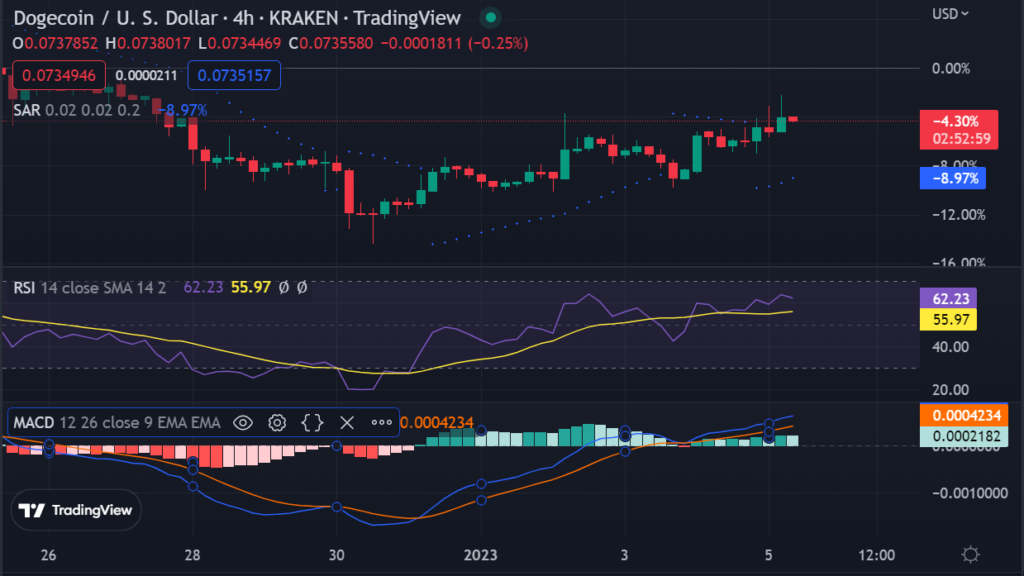
The Parabolic SAR indicator is also in a bullish mode, indicating that the bulls may have an upper hand in the short-term. The bottom line is that Dogecoin could see further gains if it can break out above the immediate resistance area of $0.077. However, any further dips should be monitored for possible buying opportunities. The next major support area for the coin is $0.056.
The Relative Strength Index indicator is headed upwards and is currently at a level of 59.39, which indicates that the coin has some room for further gains in the near term. Buying pressure could gain further steam if the RSI indicator breaches the 70 levels.
Overall, Dogecoin appears to make a solid comeback after yesterday’s brief correction. The meme coin has retested the key support area of $0.071 and is now aiming to break out above the immediate resistance area of $0.077. If it can do so, then it could see fresh highs in the near future. Also, any further dips should be monitored for possible buying opportunities.
Disclaimer: The views and opinions, as well as all the information shared in this price analysis, are published in good faith. Readers must do their own research and due diligence. Any action taken by the reader is strictly at their own risk. Coin Edition and its affiliates will not be held liable for any direct or indirect damage or loss.
Disclaimer: The information presented in this article is for informational and educational purposes only. The article does not constitute financial advice or advice of any kind. Coin Edition is not responsible for any losses incurred as a result of the utilization of content, products, or services mentioned. Readers are advised to exercise caution before taking any action related to the company.
")


