


- Bullish momentum propels DOGE towards the $0.1 resistance zone.
- Increased trading volume suggests a potential bullish trend.
- Chaikin Money Flow shows a balanced market with room to climb.
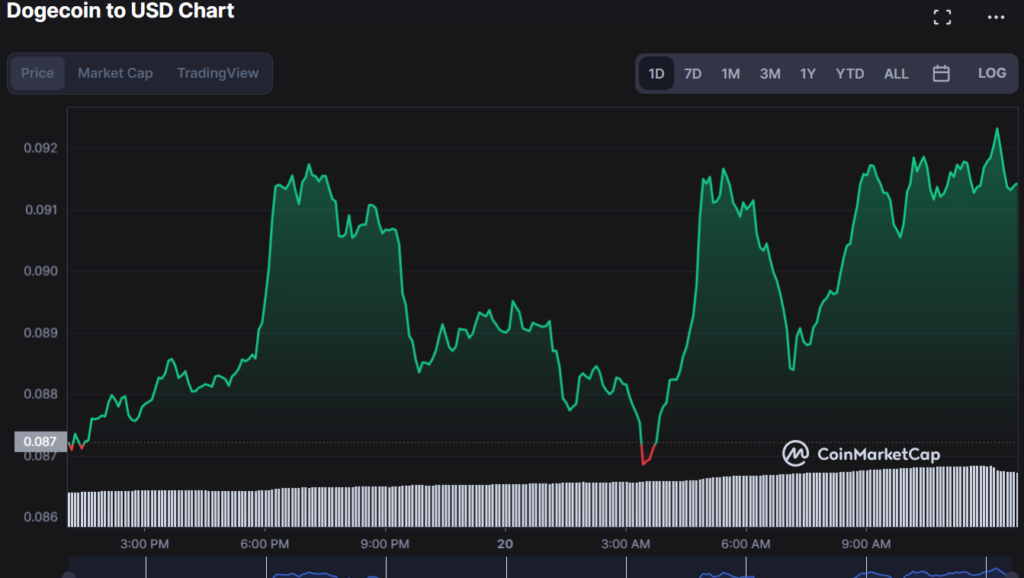
In light of 4/20 projections that Dogecoin (DOGE) may experience a significant price increase, the bulls have retained market control in the previous 24 hours. During the bull reign, the price of DOGE rose from an intra-day low of $0.08685 to an intra-day high of $0.09235 (resistance zone). The bull effect was still at work at the time of writing, triggering a 4.78% surge to $0.09152.
If the bulls maintain control and push the price above the resistance level, a surge toward $0.1 or higher may be witnessed. However, if the negative momentum maintains its hold on the market and breaks the support level, the next probable target might be around $0.085, a critical psychological milestone for many traders and investors.
During the upturn, the market capitalization and 24-hour trading volume soared by 4.98% and 58.63% to $12,708,700,314 and $1,506,981,285. This move suggests that investors are becoming more confident in the market and willing to buy and sell at higher volumes, indicating a potential bullish trend soon.
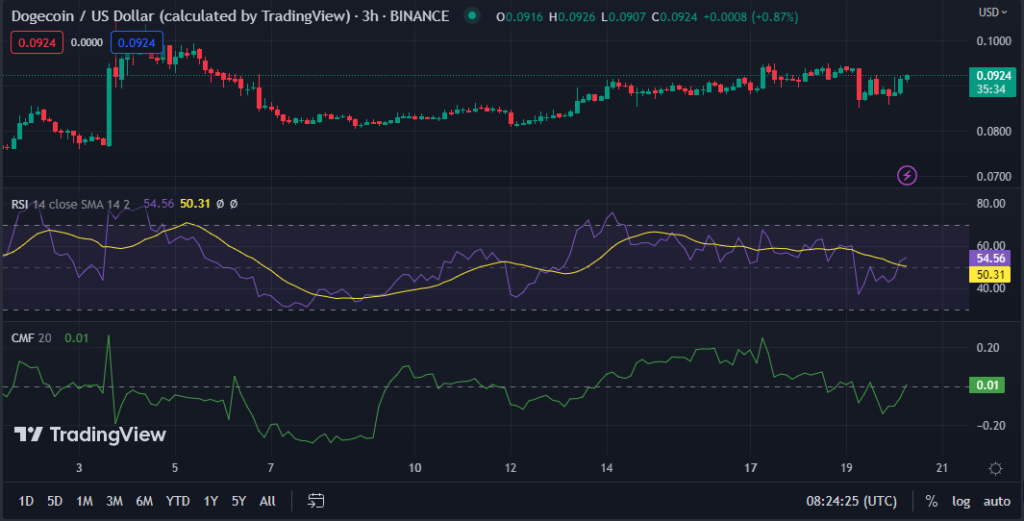
Despite being negative, the Relative Strength Index (RSI) just crossed its signal line with a reading of 54.34, indicating that the present downturn may be losing strength and a possible positive reversal may be on the horizon.
This movement and the increased trading volume signal that traders are growing more interested in purchasing the asset at its present price, which might support a possible positive turnaround in the near future.
The Chaikin Money Flow (CMF) level of -0.01 illustrates the market’s mild selling pressure, but it is still over zero, indicating that some purchasing activity is still taking place. This level and upward movement indicate a moderately balanced market where neither buyers nor sellers have a clear edge. Still, there is potential for the market to climb higher if purchasing pressure grows.
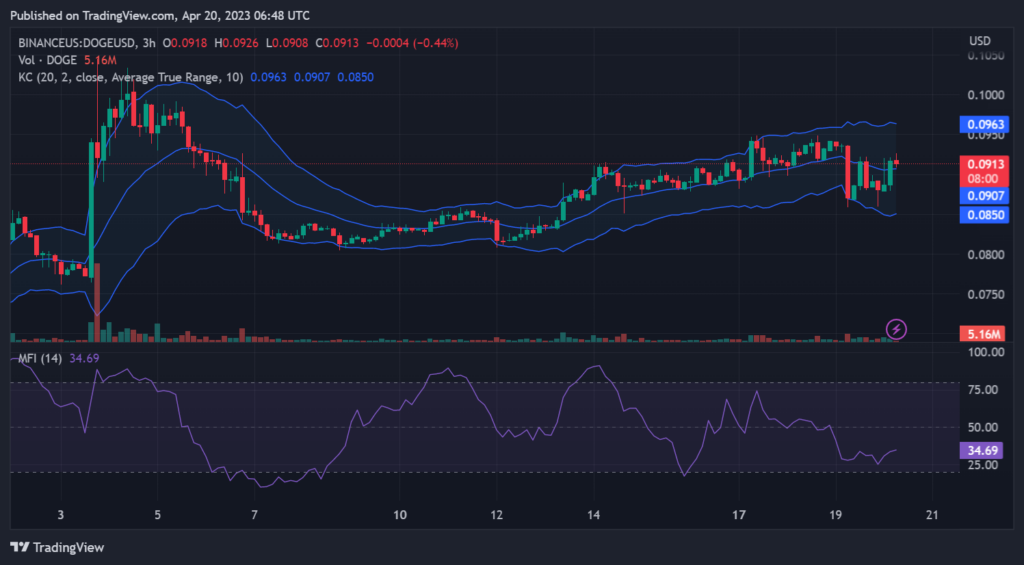
Keltner Channel bands on the DOGE/USD 3-hour price chart are bulging, with the top channel at 0.0968 and the bottom channel at 0.0846. This movement shows the increasing volatility and uncertainty in the DOGE/USD market, which may result in substantial price swings in either direction.
The price action is advancing above the middle band and creating green candlesticks to support upward momentum, indicating that a potential bullish trend is brewing in the DOGE/USD market.
The Money Flow Index (MFI) score of 34.68 indicates that the market’s bearish momentum is waning and purchasing pressure is building, indicating the probable emergence of a bullish trend. The MFI is moving upwards, showing that traders are growing more bullish and willing to pay greater prices for DOGE, signalling a likely reversal in the present slump.
In conclusion, Dogecoin’s price surge shows signs of potential upward momentum, with increased trading volume and bullish indicators pointing towards a positive reversal.
Disclaimer: The views, opinions, and information shared in this price prediction are published in good faith. Readers must do their research and due diligence. Any action taken by the reader is strictly at their own risk. Coin Edition and its affiliates will not be liable for direct or indirect damage or loss.
Disclaimer: The information presented in this article is for informational and educational purposes only. The article does not constitute financial advice or advice of any kind. Coin Edition is not responsible for any losses incurred as a result of the utilization of content, products, or services mentioned. Readers are advised to exercise caution before taking any action related to the company.


