 Price Prediction for July 18")
The Dogecoin price today has climbed to $0.213 after a bullish breakout from a multi-week descending channel structure. Price action has been supported by renewed demand, reclaiming the $0.20 level with momentum, while derivatives data suggests strong long positioning. As DOGE retests the $0.215–$0.218 resistance band, bulls are watching for continuation toward $0.225 and beyond.
What’s Happening With Dogecoin’s Price?
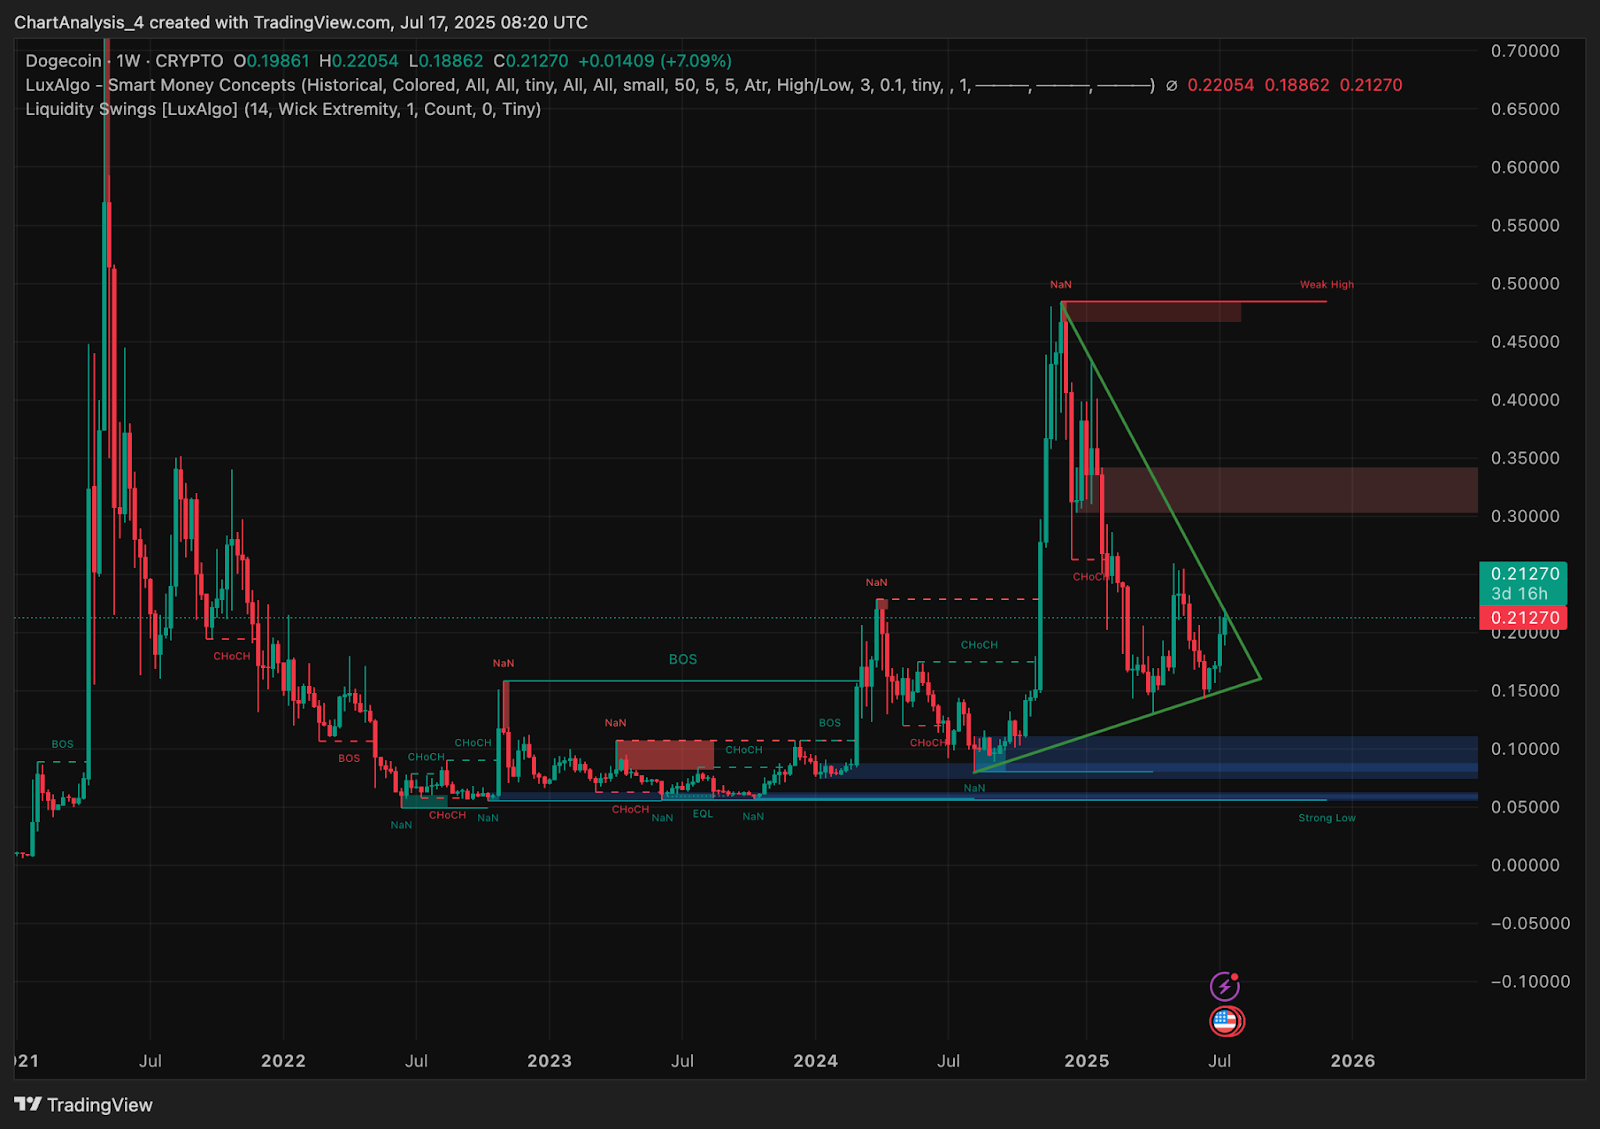
On the weekly chart, Dogecoin price has held above its long-term trendline support after forming a symmetrical triangle structure. The recent bounce from the $0.188–$0.196 range confirms bullish defense of higher lows, and DOGE is now attempting to push through key resistance around $0.215. Notably, this recovery comes after months of contraction inside a triangle formation, which now appears to be resolving upward.
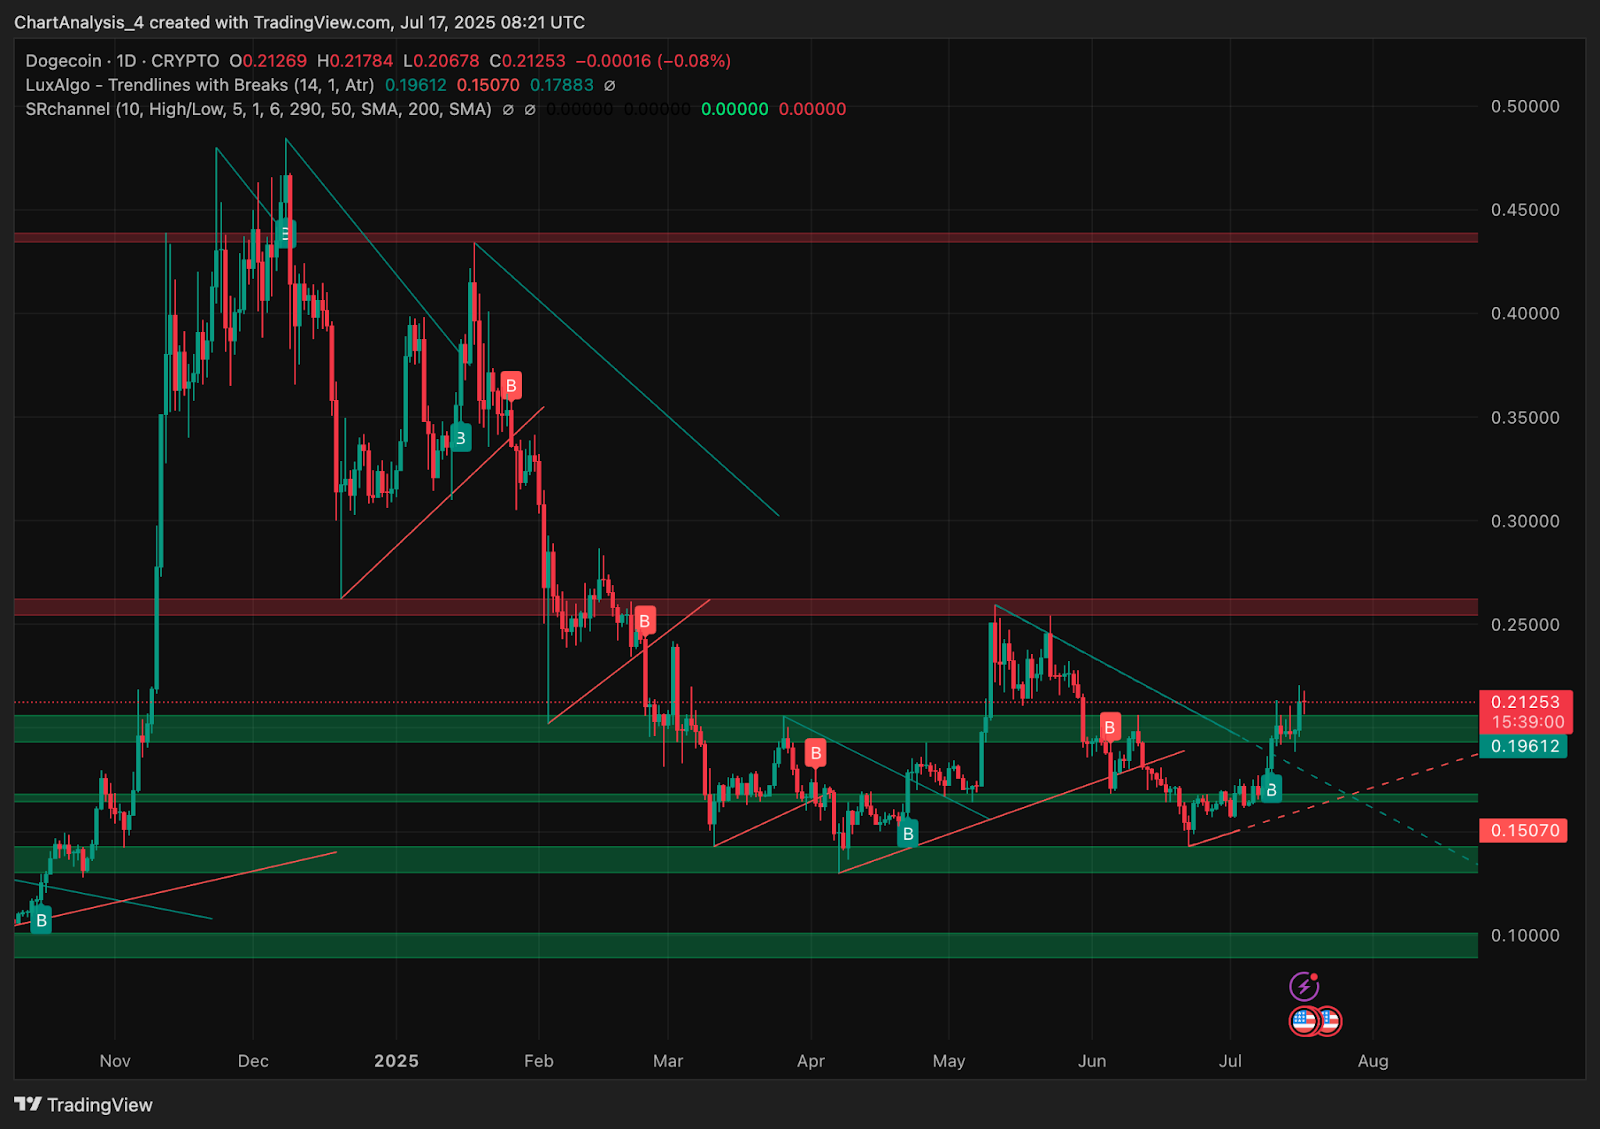
The daily chart adds further confirmation, with price action breaking through the upper boundary of the descending wedge while establishing a higher low. DOGE has cleared its immediate resistance at $0.196 and is now consolidating above this level. The Smart Money Concepts chart indicates a recent bullish CHoCH, suggesting a break of market structure and the potential start of a trend reversal.
Why Is The Dogecoin Price Going Up Today?
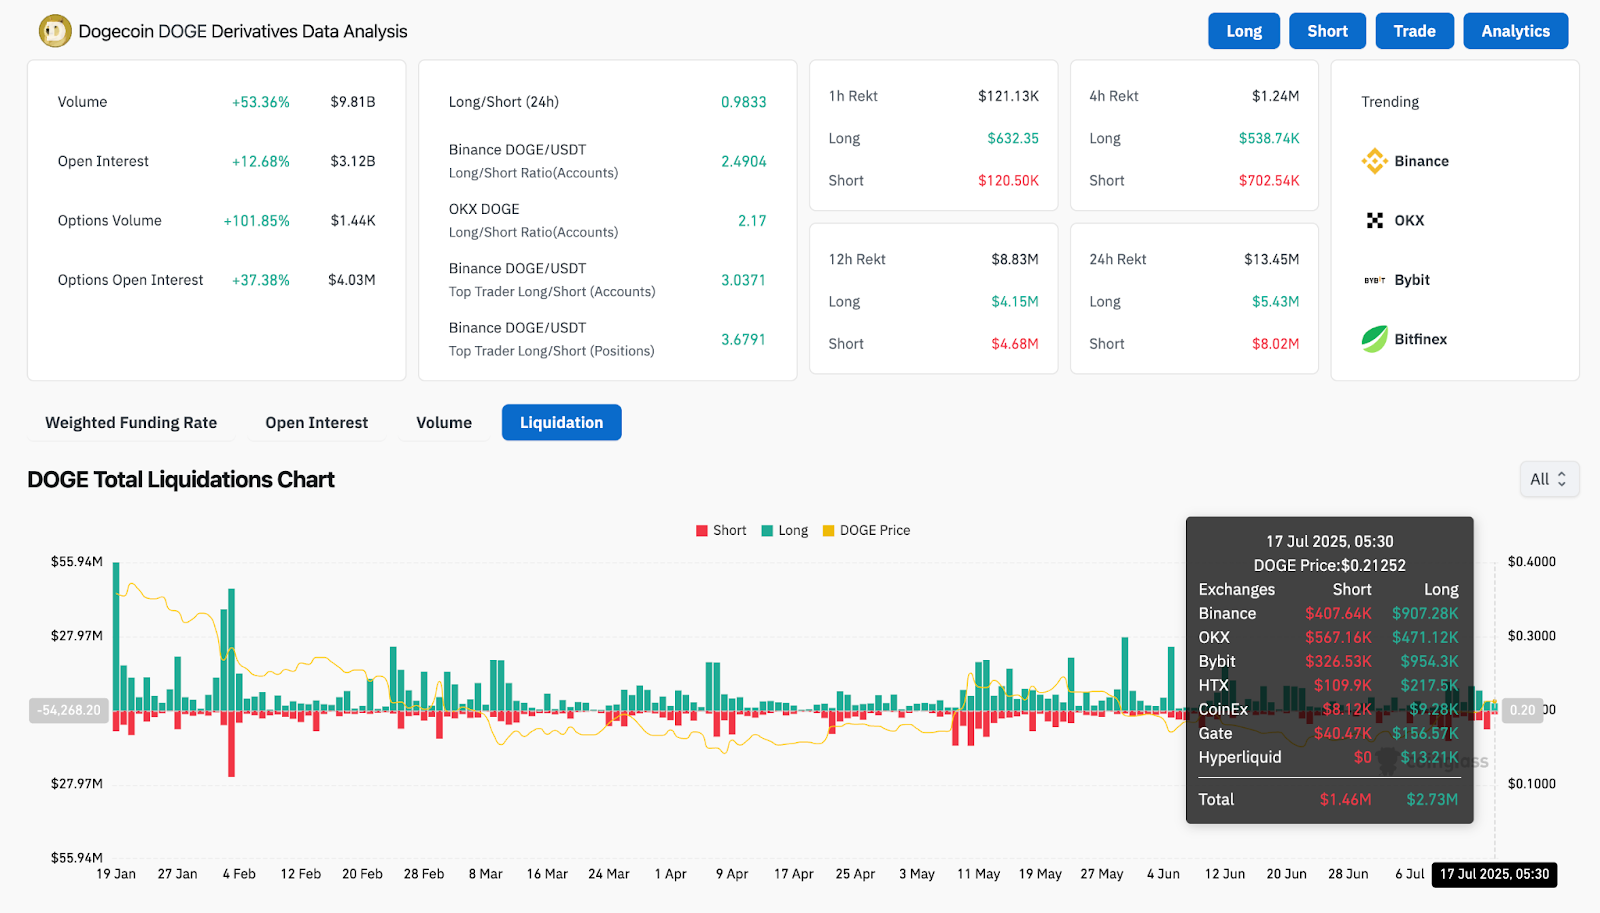
The rise in Dogecoin price today is backed by both technical breakout momentum and a sharp shift in derivatives sentiment. Data from Coinglass shows DOGE’s futures volume spiked 53.36% to $9.81 billion in the last 24 hours, while open interest surged 12.68% to $3.12 billion. Options volume doubled, and the long/short ratio on Binance stands at 2.49 among accounts and a high 3.68 for top trader positions — indicating aggressive long bias.
From a liquidation perspective, short positions worth over $1.46 million were wiped out, while long liquidations remained minimal. This skew reflects the strength of bullish pressure and short squeezes fueling price acceleration. Options open interest rose 37.38%, further supporting the outlook for continuation.
Bollinger Bands and EMAs Show Strengthening Trend
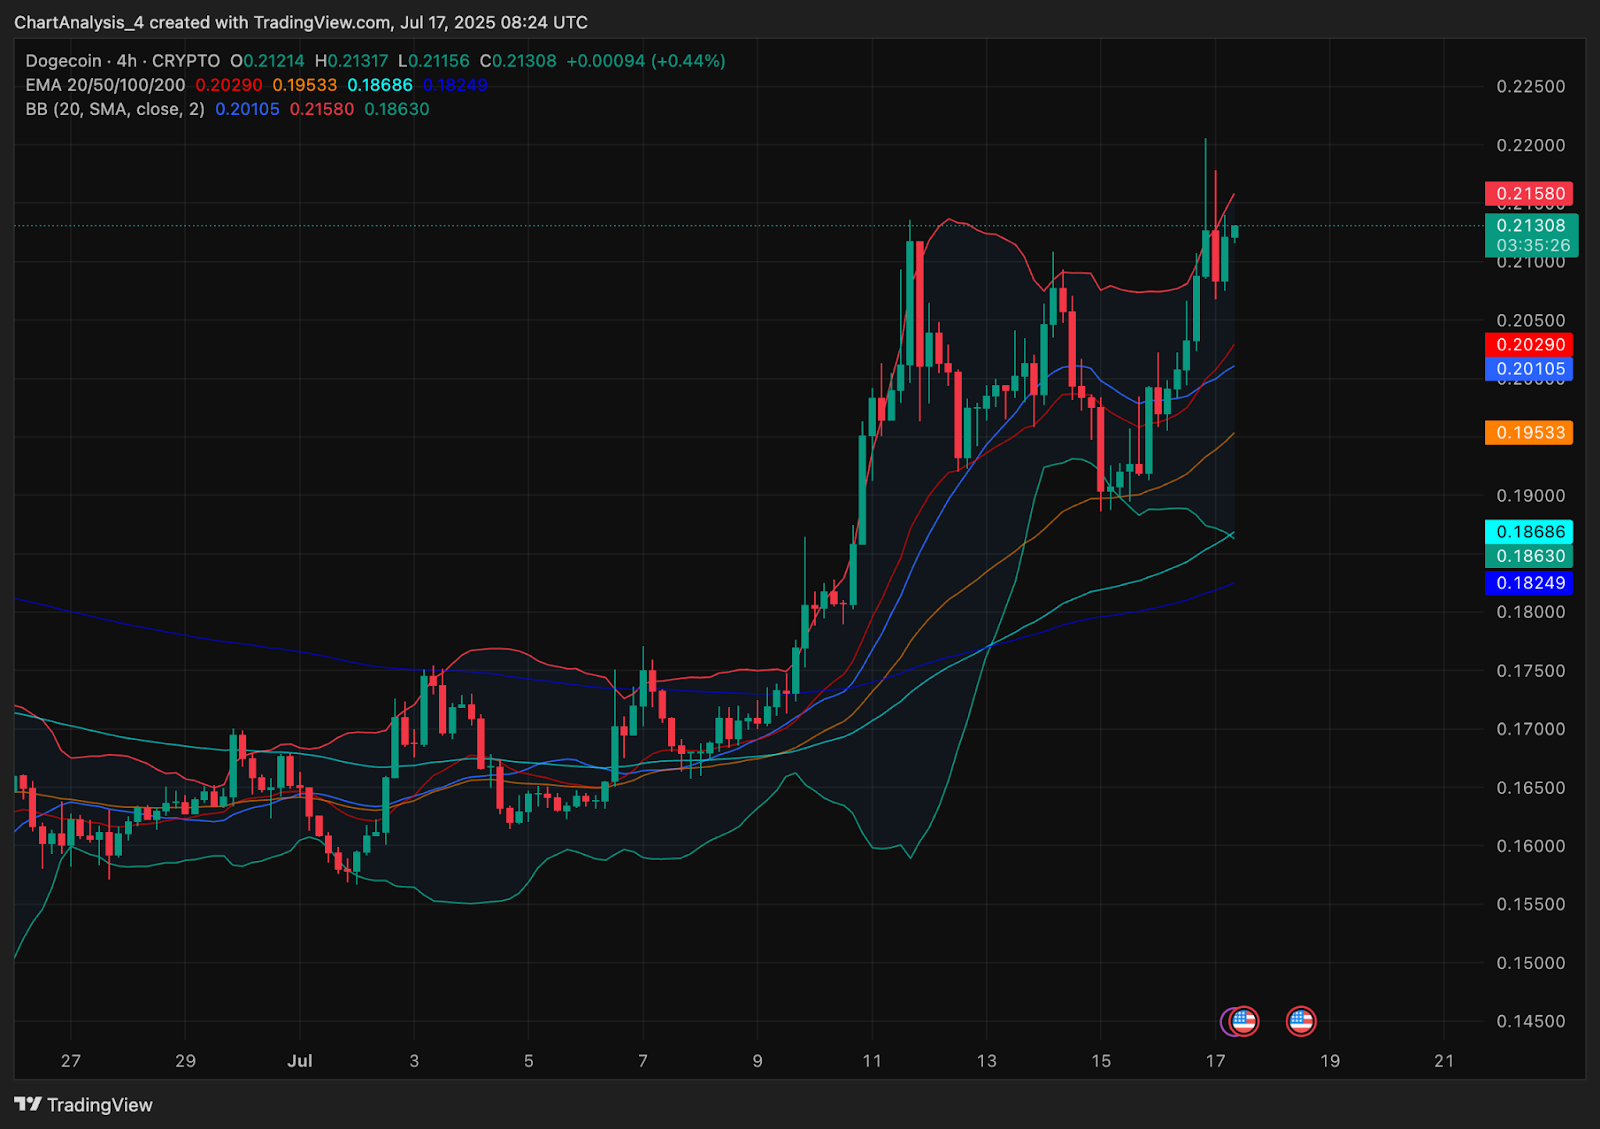
On the 4-hour chart, Dogecoin price action is trading firmly above all key exponential moving averages, with the 20 EMA at $0.202 and the 200 EMA lagging below at $0.182. The bullish stack of the 20/50/100/200 EMAs reinforces short-term uptrend strength.
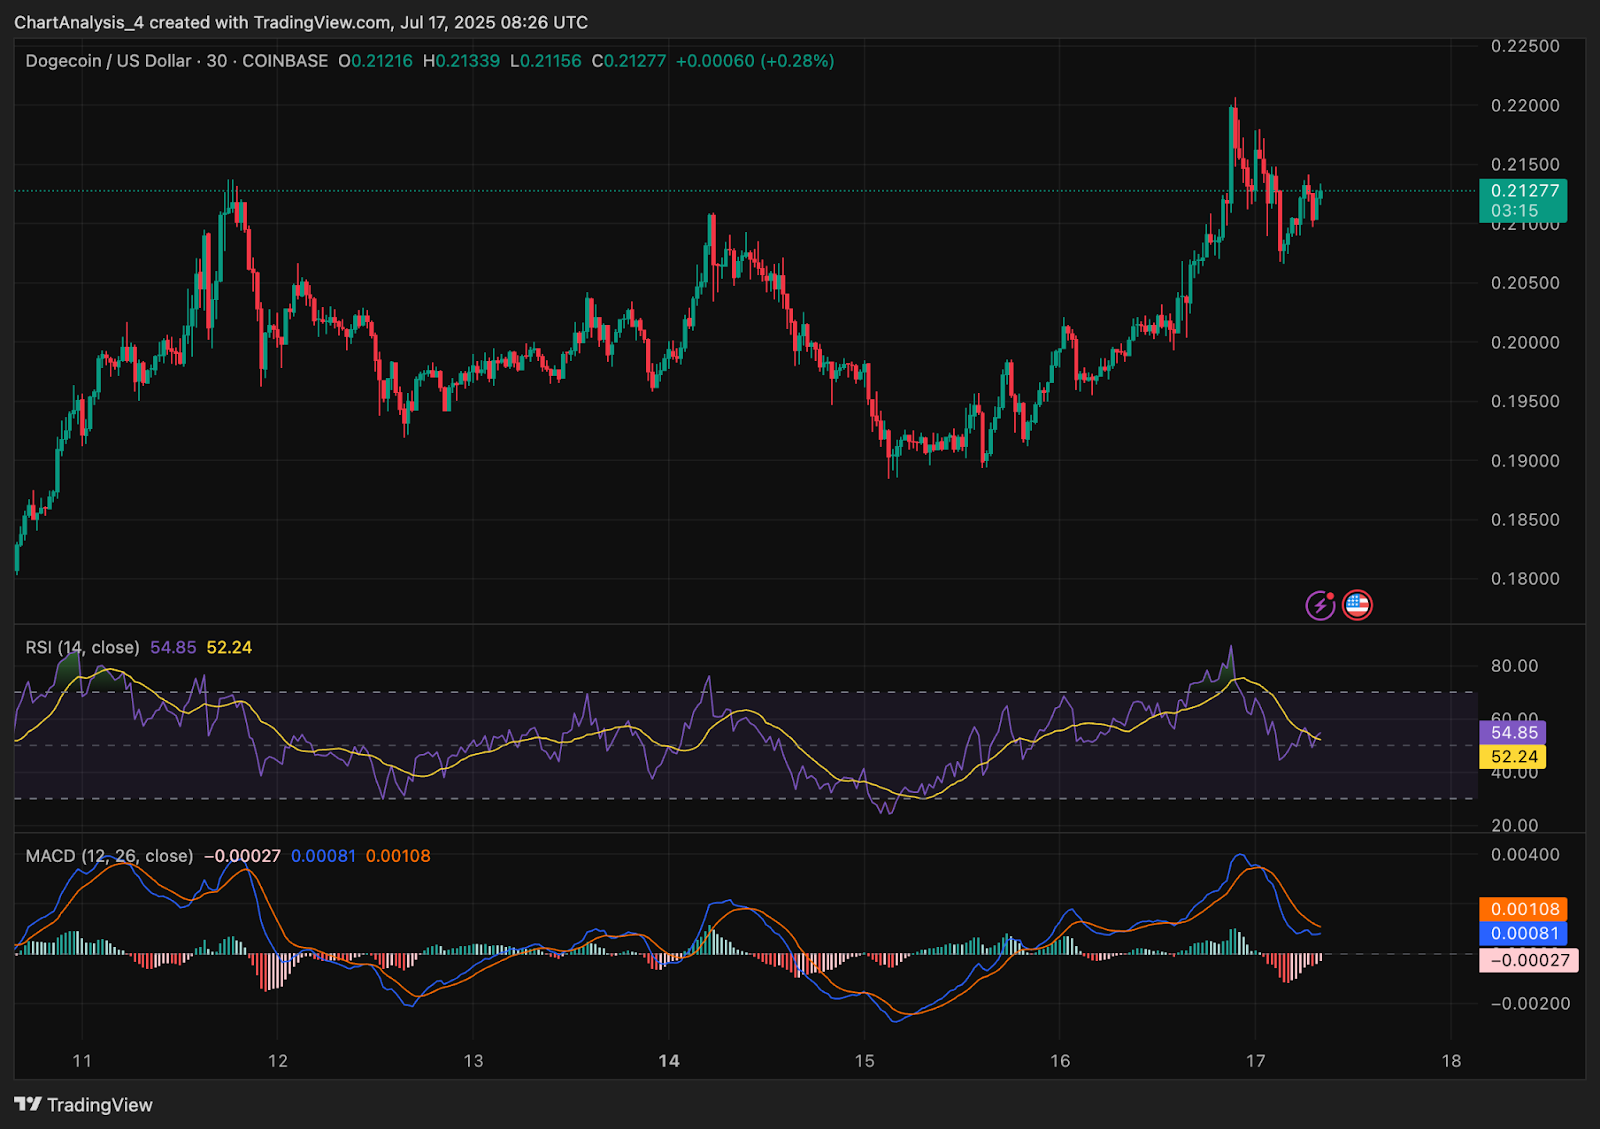
Bollinger Bands are expanding, and DOGE is attempting to close above the upper band at $0.2158. This reflects breakout volatility and may lead to price expansion if the band continues to stretch. However, the 30-minute RSI is neutral at 54.8, and the MACD is slightly bearish, suggesting consolidation may occur before further upside.
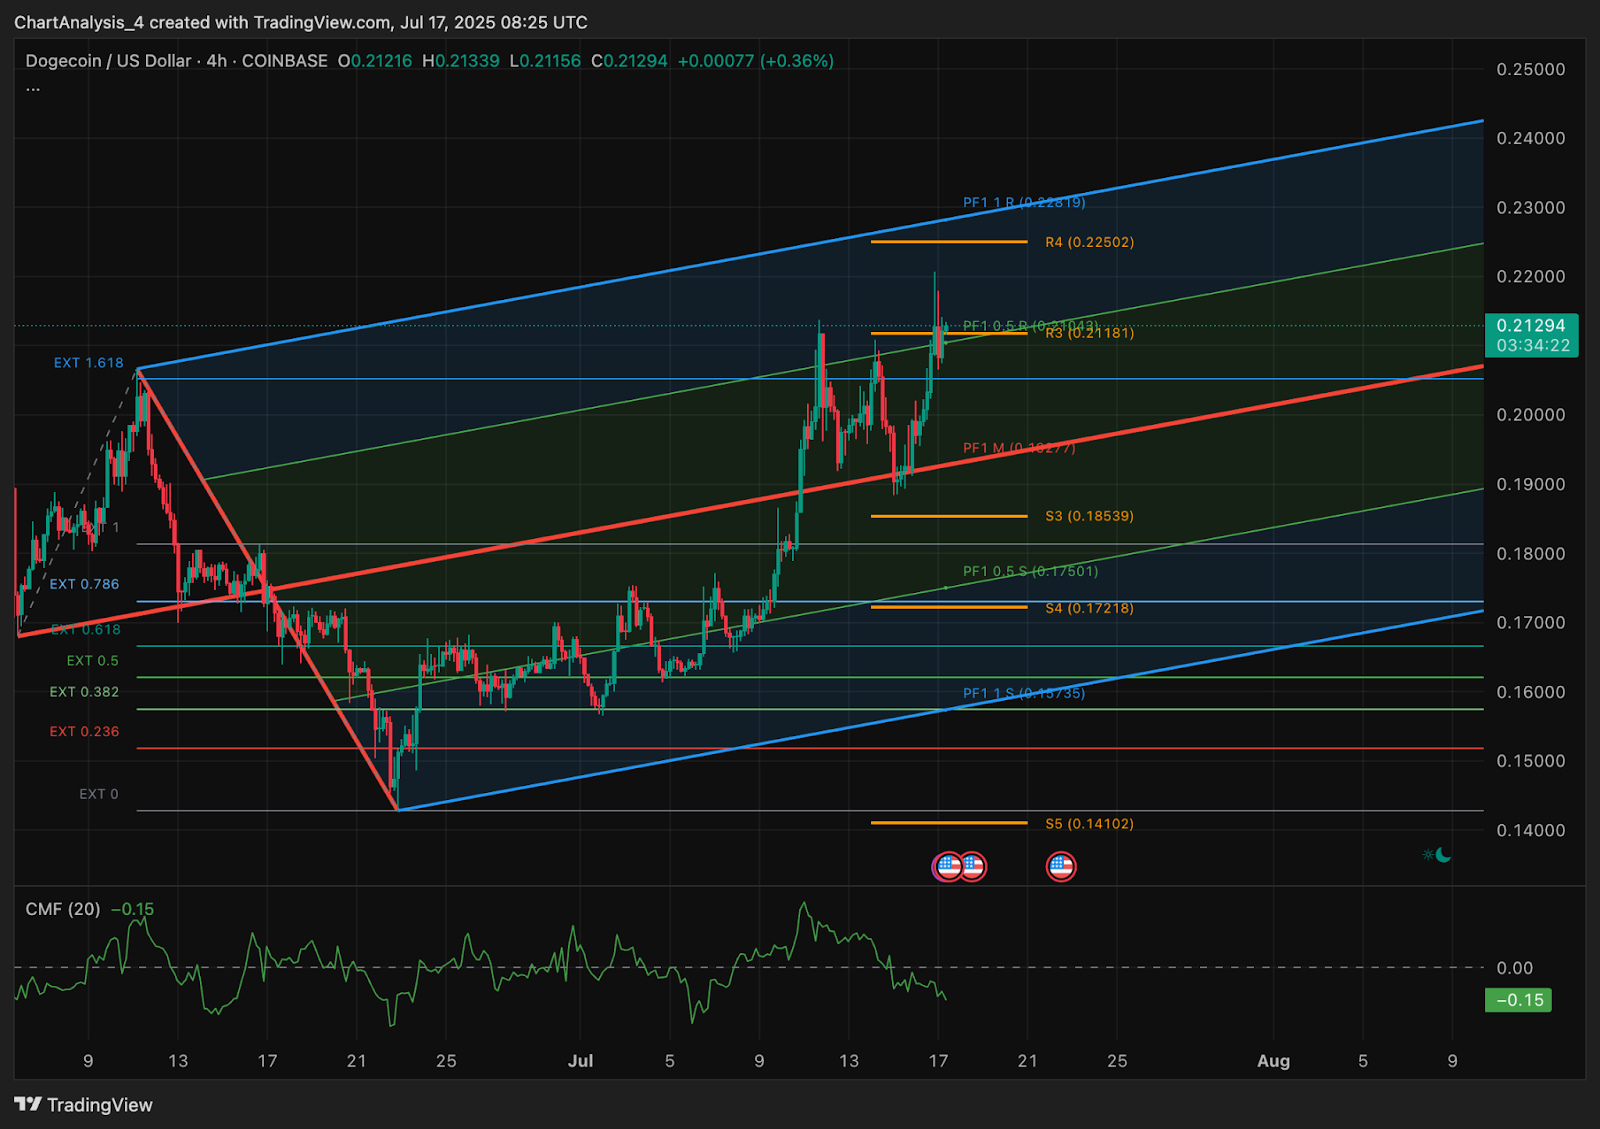
The parallel channel on the 4-hour chart shows DOGE moving within a bullish ascending range, with the midline support at $0.204 and channel top near $0.225. Fibonacci extensions and pivot levels indicate the next major target at $0.225 and $0.2319 if $0.2181 is cleared.
Dogecoin Price Prediction: Short-Term Outlook (24H)
In the next 24 hours, Dogecoin price is expected to retest the $0.218–$0.225 resistance cluster. A breakout above this zone would expose the $0.2319 target, followed by a broader move toward $0.25. Support remains at $0.204 and $0.196, which align with the mid-channel zone and prior breakout region.
If price dips back into the $0.204–$0.206 zone, bulls will look for a bounce to confirm a retest. A failure below $0.196 could delay upside momentum, with next support at $0.185.
Overall trend bias remains bullish as long as DOGE holds above $0.196 and channel support continues to guide higher lows.
Dogecoin Price Forecast Table: July 18, 2025
| Indicator/Zone | Level / Signal |
| Dogecoin price today | $0.213 |
| Resistance 1 | $0.2181 (short-term pivot) |
| Resistance 2 | $0.2250 |
| Resistance 3 | $0.2319 (Fibonacci 1.618 ext) |
| Support 1 | $0.2045 (channel midline) |
| Support 2 | $0.1960 (breakout base) |
| EMA Cluster (4H) | Bullish stack below price |
| Bollinger Bands (4H) | Expanding, upper band at $0.2158 |
| RSI (30-min) | 54.85 (neutral) |
| MACD (30-min) | Bearish crossover, weak momentum |
| Open Interest (24H) | $3.12B (+12.68%) |
| Futures Volume (24H) | $9.81B (+53.36%) |
| Long/Short Ratio (Binance Top) | 3.6791 (Strong long bias) |
| Total Shorts Liquidated (24H) | $1.46M |
Disclaimer: The information presented in this article is for informational and educational purposes only. The article does not constitute financial advice or advice of any kind. Coin Edition is not responsible for any losses incurred as a result of the utilization of content, products, or services mentioned. Readers are advised to exercise caution before taking any action related to the company.


