
- Dogecoin price today consolidates near $0.20 with buyers defending $0.197 support as a wedge breakout looms.
- Options volume spikes to $812M, the largest this month, signaling renewed speculative positioning for upside.
- Exchange flows remain muted, leaving $0.214 resistance as the key breakout trigger for the next rally.
Dogecoin price today trades near $0.20, holding steady as traders weigh whether the recent pullback is a normal pause or the start of a deeper correction. Market action has tightened around the $0.197 support, while exchange flows and derivatives data reveal a divided sentiment across the board.
Buyers Defend $0.20 Floor Ahead Of Breakout Test
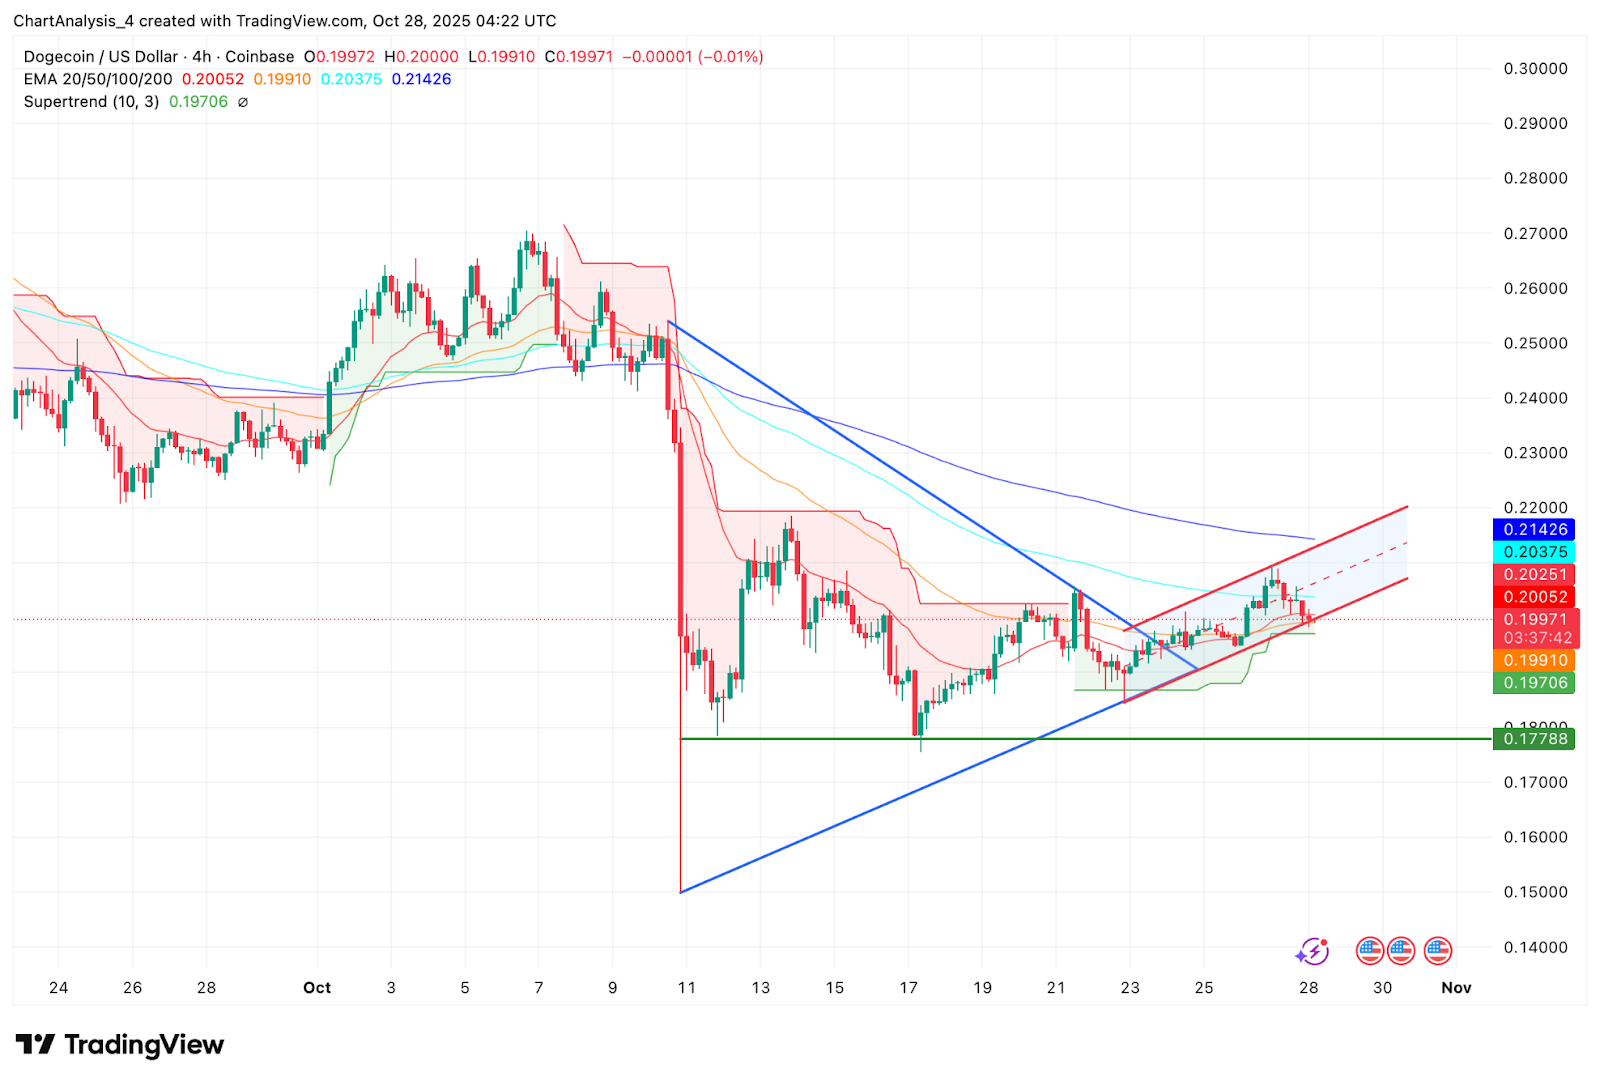
On the 4-hour chart, Dogecoin price action sits inside a narrow ascending channel after reclaiming ground from its October lows. The 20, 50, and 100 EMAs between $0.199 and $0.203 have merged into a compact support cluster that traders are actively defending.
The Supertrend line near $0.197 has held multiple times this week, giving bulls a short-term base. Above, the 200 EMA and upper channel line near $0.214 form the immediate resistance cap. A clean move through this ceiling could drive the next push toward $0.22–$0.23. Losing the $0.197 level, though, would expose the lower demand zone at $0.178 and risk breaking the channel structure.
Spot Flows Turn Defensive As Outflows Shrink
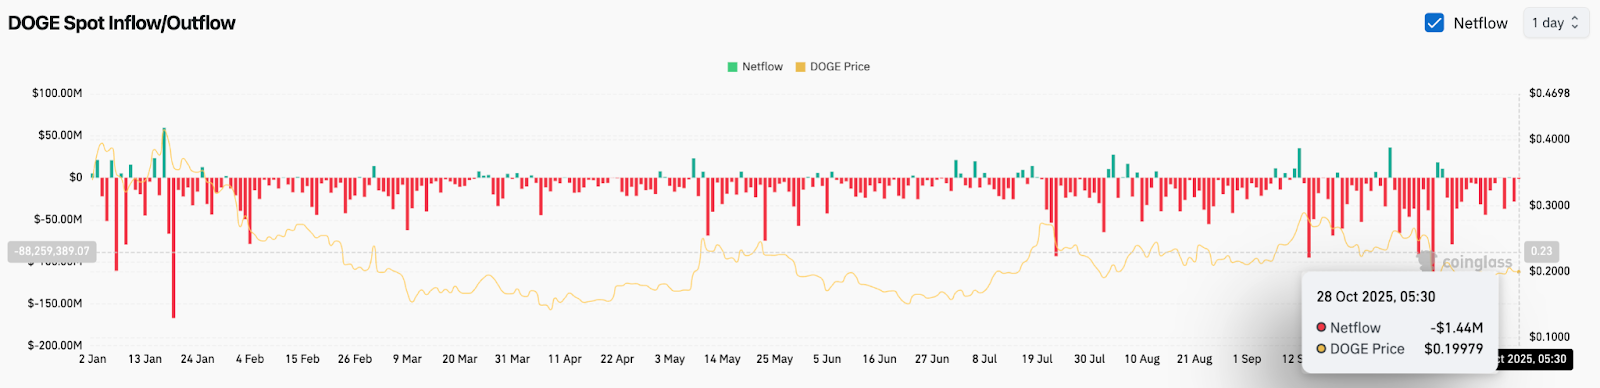
On-chain data shows net outflows of around $1.4 million on October 28, a modest figure compared with the heavy withdrawals seen earlier in 2025. The latest Dogecoin price volatility has been matched by softer outflows, hinting that traders are neither panic-selling nor heavily accumulating.
The neutral flow picture highlights a market waiting for conviction. Exchange wallets are seeing fewer large transactions, reflecting low urgency on both sides. A shift toward stronger outflows and higher spot volume would be the first sign of renewed confidence, but so far, the setup remains cautious.
Futures Cooling As Options Traders Re-Enter
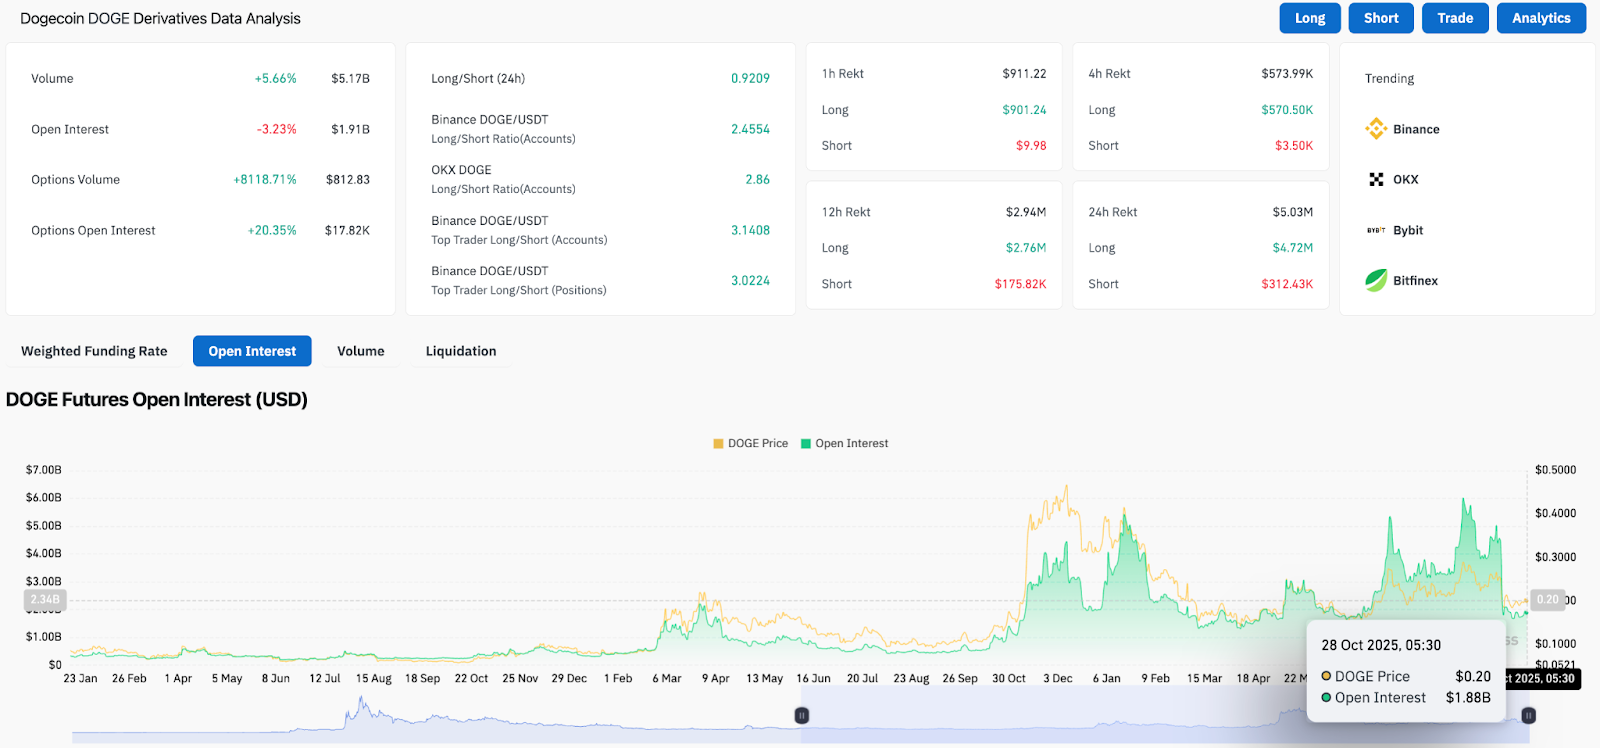
Dogecoin’s derivatives landscape reflects reduced leverage after last week’s liquidations. Futures open interest has slipped 3.2% to $1.91 billion, even as trading volume rose 5.6% to $5.17 billion. The mix points to short-term unwinding rather than fresh positioning.
The standout figure is options volume, which spiked sharply to $812 million — its largest daily rise this month. That surge came mainly from speculative upside plays, aligning with the Binance and OKX long/short ratios above 2.5. While sentiment leans bullish, overall participation remains below peak levels seen in midyear rallies.
This balance shows traders are staying selective: open longs are still dominant, but new leverage is entering slowly. Sustained buildup in open interest near $2 billion would mark a meaningful shift toward trend continuation.
Daily Chart Builds Pressure Inside Symmetrical Triangle
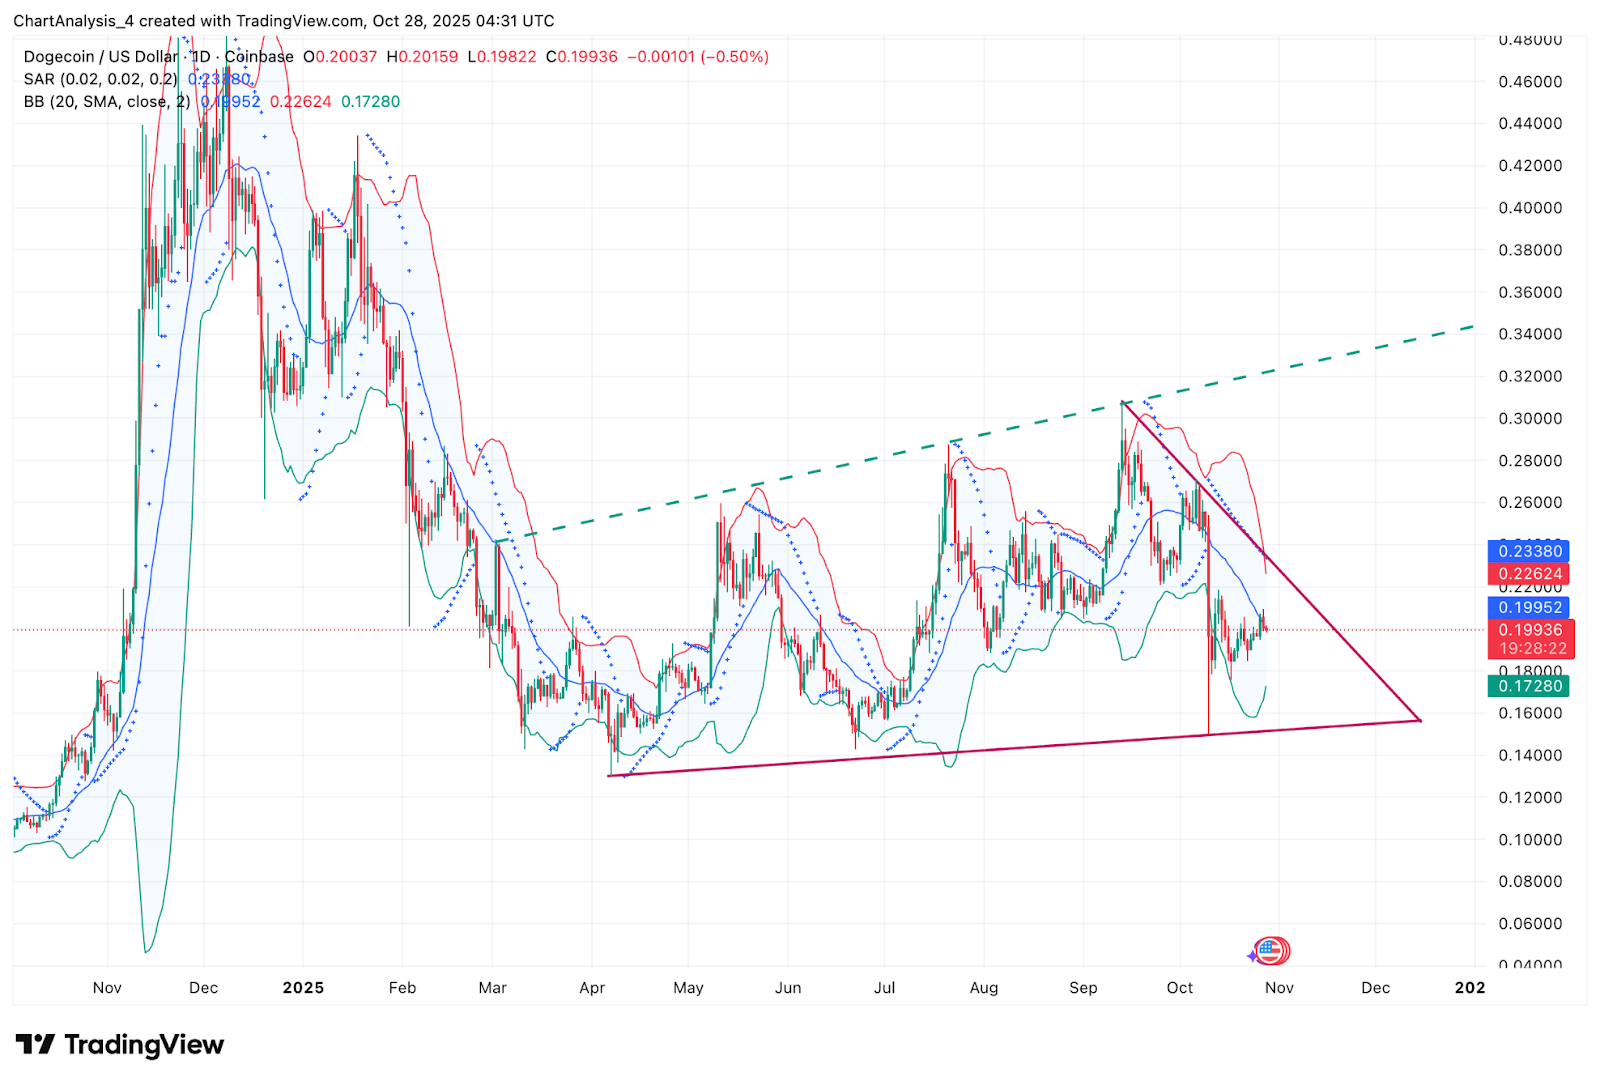
On the broader daily view, Dogecoin price prediction centers around a compressing symmetrical triangle that has governed action since June. The lower trendline at $0.172 has contained every major correction, while the upper boundary near $0.23 remains the key breakout threshold.
Bollinger Bands have tightened to one of their narrowest widths this quarter, a sign of upcoming expansion in volatility. The Parabolic SAR still sits above price, keeping bias slightly bearish until a daily close above $0.21 reverses that signal. Historically, similar squeezes have preceded impulsive moves once price crosses a major boundary with volume.
Outlook: Will Dogecoin Go Up?
Dogecoin price today holds its short-term uptrend as long as it trades above $0.197. A move through $0.214 could clear the path toward $0.23 and potentially $0.25, completing a medium-term reversal setup.
Failure to hold $0.197 would weaken structure and likely bring a retest of $0.178 before bulls regroup. Exchange flows remain quiet, so a sudden rise in spot activity or a shift in derivatives funding would be key signals to watch.
At this stage, Dogecoin’s recovery hinges on sustaining higher lows while approaching the triangle’s apex. Breakout confirmation above $0.214 would tilt the bias firmly upward, while continued stalling would keep price locked in range through early November.
DOGE Technical Summary
| Indicator | Bias | Key Levels |
| Short-Term Support | Bullish | $0.197, $0.178 |
| Resistance Zone | Neutral | $0.214–$0.233 |
| EMA Cluster | Support Band | $0.199–$0.203 |
| Bollinger Range | Compression Zone | $0.172–$0.226 |
| Overall Outlook | Neutral-to-Bullish | Watching breakout at $0.214 |
Disclaimer: The information presented in this article is for informational and educational purposes only. The article does not constitute financial advice or advice of any kind. Coin Edition is not responsible for any losses incurred as a result of the utilization of content, products, or services mentioned. Readers are advised to exercise caution before taking any action related to the company.


