
- XRP price shot up 8% with increased trading volume, reclaiming the 20-day EMA at $2.11.
- The active addresses on the XRP Ledger have soared 67.50%, rising from 27,352 to 40,366.
- XRP has formed a falling wedge on the daily chart and the potential bullish target stands at $3.20.
XRP turned decidedly bullish over the past 24 hours, surging nearly 8%. This strong move helped the digital asset reclaim a market capitalization above $130 billion, significantly boosted by an 89.75% explosion in trading volume signaling renewed trader interest.
Importantly, XRP’s price pushed above key near-term resistance. It successfully reclaimed its 20-day Exponential Moving Average (EMA) around $2.11, suggesting this level could flip to support. Also, the broader $2.10–$2.20 resistance zone was breached; holding above here is crucial short-term.
Rising On-Chain Activity Adds to Bullish Case
Adding weight to the bullish case, recent on-chain data shows substantial network growth. Analyst Ali Martinez highlighted a significant 67.5% spike in XRP network activity (Apr 19-20), with daily active addresses jumping sharply from ~27k to over 40k.
This uptick shows growing user engagement, often preceding price moves and potentially signaling quiet accumulation during that period’s flat price.
Related: Circle Introduces CPN for Global Payments; How Does It Stack Up to XRP?
Technical Indicators Signal Breakout Potential
Analyzing the daily XRP chart (via TradingView), a falling wedge pattern is confirmed – a technical formation often preceding bullish reversals.
The potential target of this pattern is calculated by measuring the height of the wedge at its widest point and adding it to the breakout point.
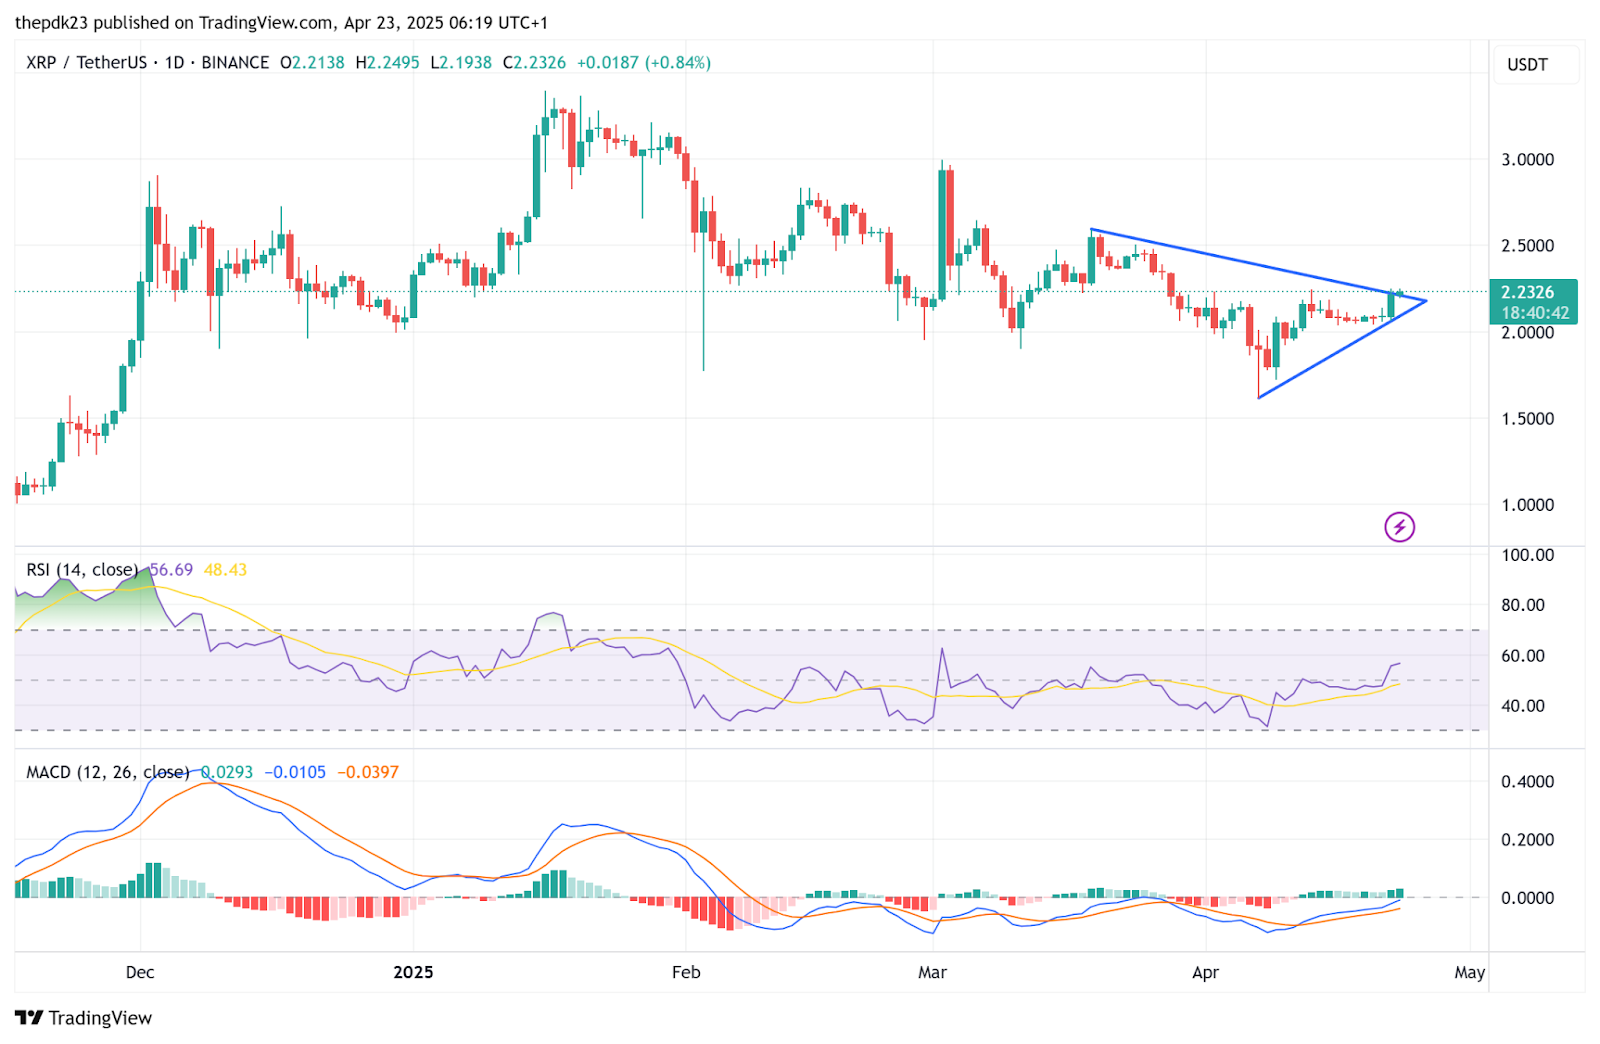
Based on the chart, the falling wedge’s widest point appears to be roughly between $1.60 and $2.50, giving a height of $0.90. If a breakout occurs above the upper trendline, currently around $2.30, a potential bullish target could be in the vicinity of $3.20 ($2.30 + $0.90).
Related: XRP Got Federal Clarity But New State Lawsuit vs Coinbase Adds Wrinkle
On the other hand, the Relative Strength Index (RSI) stands at 56.69, positioned above the neutral level of 50. This indicates increasing buying pressure and suggests that the bullish momentum is gaining strength.
The Moving Average Convergence Divergence (MACD) indicator shows the MACD line (blue) above the signal line (orange), and the histogram is printing positive values. There is a substantial possibility of another price breakout.
Key Price Levels: Targets and Support
Considering the recent price action, the immediate target for XRP is the recent high around $2.25. Another short-term target, based on the falling wedge pattern, is $3.20.
The immediate support is the reclaimed 20-day EMA around $2.11 while another key support zone is the $2–$2.10 area.
Disclaimer: The information presented in this article is for informational and educational purposes only. The article does not constitute financial advice or advice of any kind. Coin Edition is not responsible for any losses incurred as a result of the utilization of content, products, or services mentioned. Readers are advised to exercise caution before taking any action related to the company.


