


- Ape Coin near previous swing high $7.8 with the introduction of Dookey Dash game.
- The bulls gradually steer APE higher and end the week with three higher highs.
- The first parabolic curve was dismantled, the second curve could take the same route.
Crypto Influencer Crypto Tony tweeted that Ape Coin (APE) was nearing the previous swing high of $7.8 which he predicted earlier. Shedding more light into the reasons for the rise in APE, Tony pointed out that the Dookey Dash game which was released by the Bored Ape Yacht Club (BAYC) has been the pinnacle of success for APE.
This “runner style” game which is similar to Temple Run, Subway surfer, involves the user to dodge, duck, and dive to avoid obstacles. Moreover, Tony states that since users buy the “Power Up” option that gives the player super powers on the game, APE has surged.
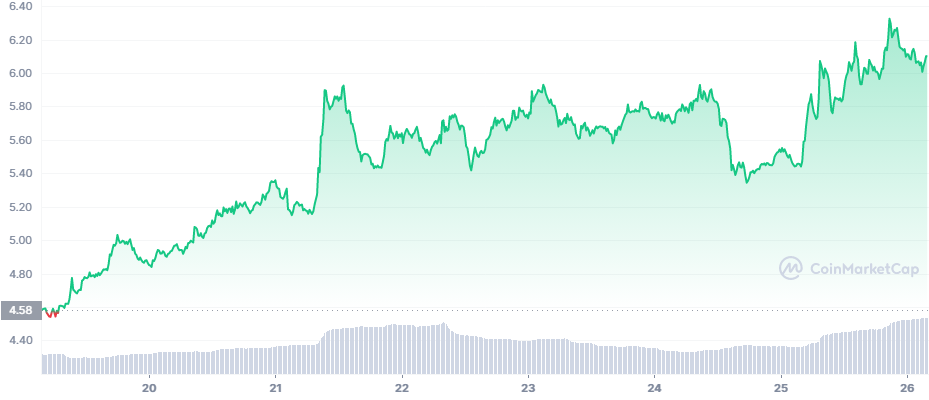
Meanwhile, APE was priced at $4.58 when the markets opened for trading. Although during the first day, APE rose gradually, the bulls catapulted the token on the second day. APE surged from $5.13 to $5.89 within just a few hours. However, following that sudden spike, APE has been rising gradually while fluctuating in the $5.40-$6.00 range until the fifth day. But during the last hours of the fifth day, APE lost momentum and its price tanked from $5.9 to $5.35 within a few hours. APE has made three new higher highs $6.07, $6.18 and $6.32. Currently, ApeCoin is up 11.27% in the last 24 hours and is exchanging hands at $6.07.
During the mid week of November, APE started rising in a parabolic curve (red), however towards the last day of November, APE broke out from its exponential rise, as shown below. The token started to move sideways. It could be because it hit the upper Bollinger band and the market corrected the prices. Notably, the RSI was at 71.29 when the breakout happened.
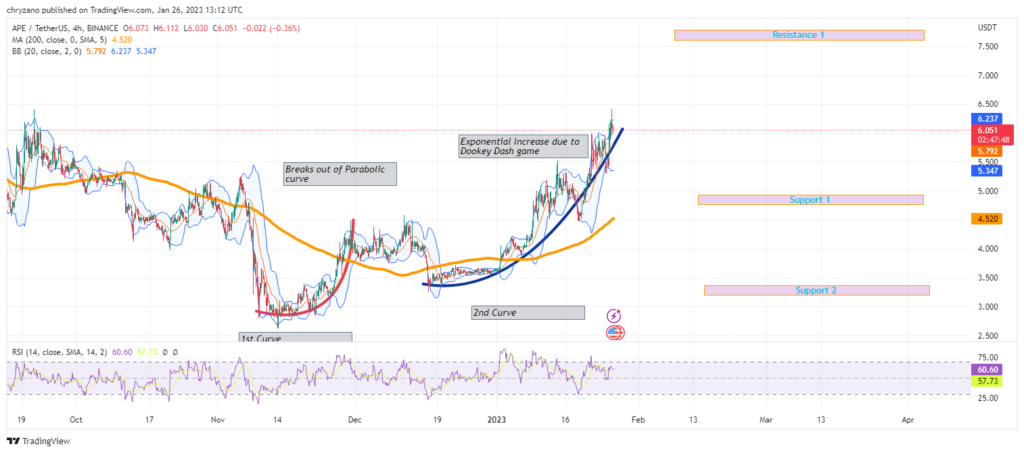
When considering the second curve (blue), APE fluctuated with very limited vertical movements as the buyer and seller were quite dormant during the last week of December. However, with the dawn of the new year, APE was able to break above the 200-day MA (yellow) and thereafter fluctuate with more amplitude.
Traders have to be on the lookout, as currently APE has touched the upper Bollinger band. The market may reverse the trend and APE could move sideways as it did during the first curve. Hence, there seems to be more volatility in the horizon as the Bollinger bands are widening.
Moreover, the RSI at 62.16 is neither overbought nor oversold, hence, the price could move either way. To be on the safer side short entry traders may look to exit this point as there is more volatility in the market. If the bears take control, then APE may tank to Support 1.However, by the looks of it the 200-day MA may intervene before APE touches support 1.
Those holding a long position may have to wait a bit longer as APE might consolidate without the help of the bulls. However, if the bulls run rampant, APE will hit resistance 1 in no time. It will be a test of time for the long traders.
Disclaimer: The views and opinions, as well as all the information shared in this price analysis, are published in good faith. Readers must do their own research and due diligence. Any action taken by the reader is strictly at their own risk, Coin Edition and its affiliates will not be held liable for any direct or indirect damage or loss.
Disclaimer: The information presented in this article is for informational and educational purposes only. The article does not constitute financial advice or advice of any kind. Coin Edition is not responsible for any losses incurred as a result of the utilization of content, products, or services mentioned. Readers are advised to exercise caution before taking any action related to the company.


