


- dYdX token has decreased by 7.00%.
- The DYDX token’s support level is present at $2.26.
- There is a bullish divergence pattern developing in the RSI indicator.
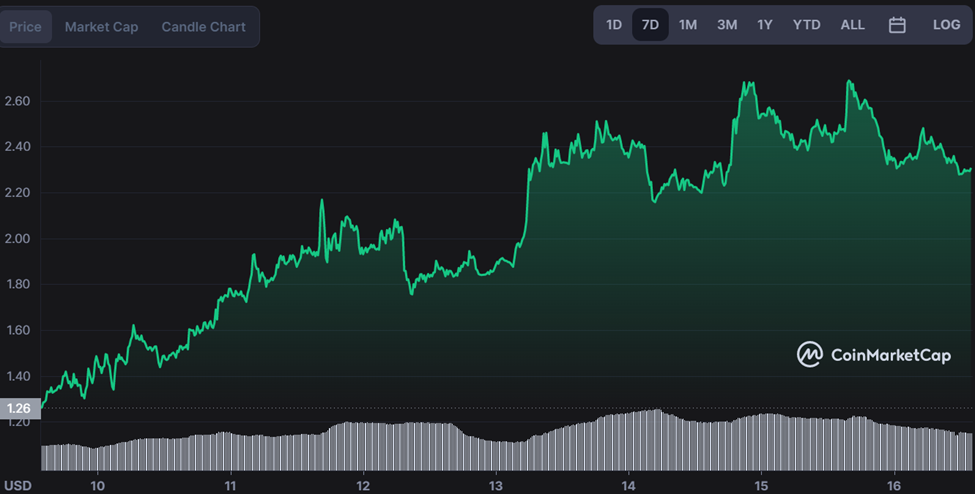
Recently, the dYdX token has been on a bullish streak, with its price surging to almost $2.70 last week. However, after forming a double-top structure at this level, the token has dropped back down to $2.30.
The digital asset has faced selling action on the 4-hour and 2-hour timeframe, with the MA 100 acting as a dynamic support. We are currently seeing the emergence of a bullish divergence pattern in the RSI indicator, which could signal that further gains may soon be on the horizon.
At the moment, DYDX is trading at $2.30, representing a 7% drop from its daily high of $2.70.
DYDX/USD price analysis on the 4-hour chart shows the pair formed a double-top bearish reversal pattern. The price action has been range-bound for the past three days, which could lead to further declines. The pattern indicates that a drop to the $2.26 support level is likely, as the market consolidates while momentum turns bearish.
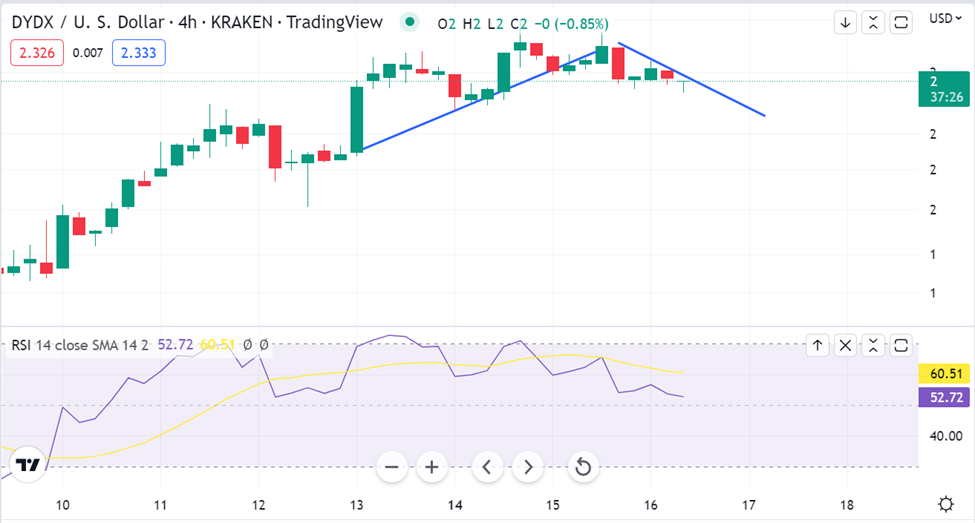
The Stochastic Oscillator also points to a sell signal, suggesting that further declines could be imminent. However, if the bulls can stage a strong comeback and push prices higher from here, we could see the emergence of fresh bullish momentum.
dYdX price analysis on the daily chart indicates a bullish divergence as the RSI line is at $63.82. This indicates the momentum in price is slowing down and could signal that the token may be on track for a reversal. For further support, the MA 100 line provides an additional layer of protection at $2.26.
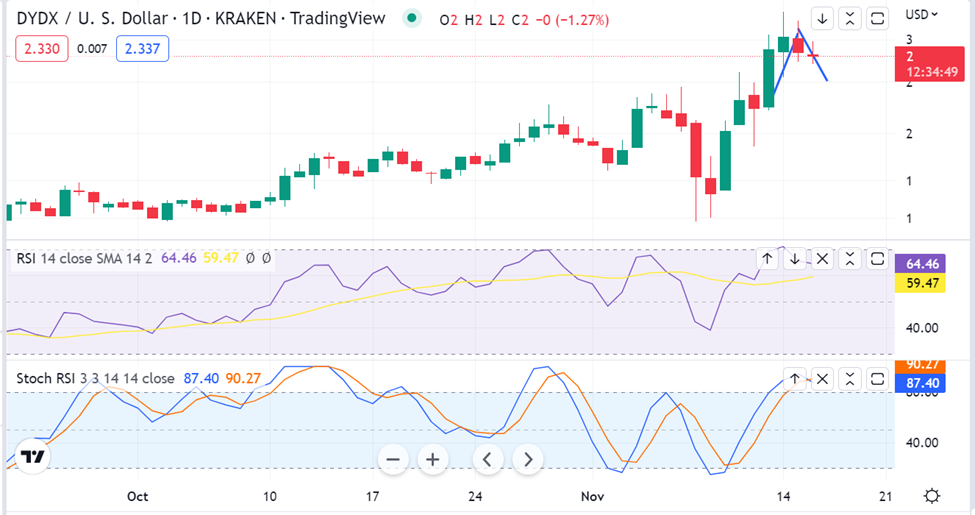
The Moving Average Divergence Convergence line (MACD) signals that the token’s price could be in for a further rally, as it is currently trading above its signal line.
Given the bearish market sentiment, many traders and investors are looking to dYdX for stability during times of volatility. The Bollinger bands are seen to be diverging and expanding, suggesting that further price increases may be on the horizon.
The immediate support level for dYdX is found at $2.26, with resistance above that at $2.33 and $2.39. Overall, the token’s current price action could signal a potential trend reversal, so long as it maintains its bullish divergence pattern on the daily chart. Moreover, the outlook remains bearish for DYDX tokens in the short term, although a longer-term price increase is still possible if support holds at $2.26. To capitalize on this opportunity, traders may consider buying DYDX tokens at current levels with a stop-loss below the $2.26 support level.
Disclaimer: The views and opinions, as well as all the information shared in this price prediction, are published in good faith. Readers must do their research and due diligence. Any action taken by the reader is strictly at their own risk. Coin Edition and its affiliates will not be held liable for any direct or indirect damage or loss.
Disclaimer: The information presented in this article is for informational and educational purposes only. The article does not constitute financial advice or advice of any kind. Coin Edition is not responsible for any losses incurred as a result of the utilization of content, products, or services mentioned. Readers are advised to exercise caution before taking any action related to the company.


