


 Price Prediction 2024-2030: Will DYM Price Hit $5 Soon?")
Dymension (DYM) has been gaining significant traction in the crypto space, drawing attention for its innovative approach and promising future. With the cryptocurrency market continuously evolving, Dymension is poised to make its mark, and investors are eager to understand where its price might head in the coming years.
Amidst this excitement, market participants are keenly analyzing Dymension’s potential, considering its current market status, technological advancements, and overall market sentiment. This article explores the potential price trajectory of Dymension (DYM) from 2024 to 2030, providing insights into where this cryptocurrency could be headed.
Table of contents
Dymension (DYM) Real Time Market Status
| 🪙 Name | Dymension |
| 💱 Symbol | DYM |
| 🏅 Rank | #1038 |
| 💲 Price | $0.014258033690192 |
| 📊 Price Change (1h) | -1.56 % |
| 📊 Price Change (24h) | -3.86 % |
| 📊 Price Change (7d) | -6.56 % |
| 💵 Market Cap | $8082316.4488317 |
| 💸 Circulating Supply | 566860524 DYM |
| 💰 Total Supply | 1069090937 DYM |
Dymension (DYM) is currently trading at $0.014258033690192 and sits at number #1038 on CoinMarketCap in terms of market capitalization. There are 566860524 DYM coins currently in circulation, bringing the total market cap to $8082316.4488317.
Over the past 24 hours, Dymension has decreased by 3.86%. Looking at the last week, the coin is down by 6.56%.
What is Dymension (DYM)?
Dymension is a cutting-edge blockchain network designed to power decentralized applications with an emphasis on scalability, speed, and efficiency. The Dymension platform is known for its advanced technology that enables developers to create and deploy decentralized applications (dApps) that are highly scalable and secure.
The Dymension ecosystem is supported by a robust community and a series of strategic partnerships that enhance its overall functionality and adoption. This has positioned Dymension as a promising project in the rapidly growing world of decentralized finance (DeFi) and blockchain technology.
Dymension (DYM) Current Market Status
Over the past month, Dymension has shown significant strength, with its price climbing from a low of $1.10 to a high of $1.30. This upward trend is visible on both daily and weekly charts, which recorded gains of 8.34% and 5.40%, respectively.
As of now, Dymension is valued at $1.24, with a market cap of nearly $1.95 billion. This price movement is supported by a circulating supply of 1,572,824,817 DYM tokens. The trading volume for Dymension has also been strong, reflecting the increasing interest from the crypto community.
In the last 24 hours, the trading volume surged by 5.40%, reaching $44.85 million. This uptick suggests growing confidence among investors, driven by the positive market trends and the ongoing development within the Dymension ecosystem. Dymension’s price range has fluctuated between $1.14 and $1.30, with solid support around the $1.20 mark.
Dymension (DYM) Price Prediction 2024-2030 Overview
| Year | Potential Low ($) | Potential High ($) |
| 2024 | $1.30 | $1.60 |
| 2025 | $1.50 | $2.00 |
| 2026 | $1.80 | $2.50 |
| 2027 | $2.00 | $3.00 |
| 2028 | $2.50 | $3.50 |
| 2029 | $3.00 | $4.00 |
| 2030 | $3.50 | $5.00 |
Dymension (DYM) Price Prediction/Analysis
Dymension’s recent price movements have attracted the attention of traders and analysts alike. While the token has shown resilience in the face of market volatility, there is a growing anticipation of a potential breakout in the coming years. Below is an in-depth analysis of Dymension’s price prediction from 2024 to 2030.
Dymension (DYM) Price Prediction – Moving Averages
Looking at an in-depth analysis, we see that the DYM/USDT pair has been on an upward trajectory, reflected in the series of higher highs and higher lows. This suggests a bullish trend over the short term. The recent pullback from the $1.583 high indicates a period of consolidation, where the price is likely taking a breather before the next move.These moving averages are part of the Alligator indicator, a technical tool that helps identify trends and potential trend reversals.
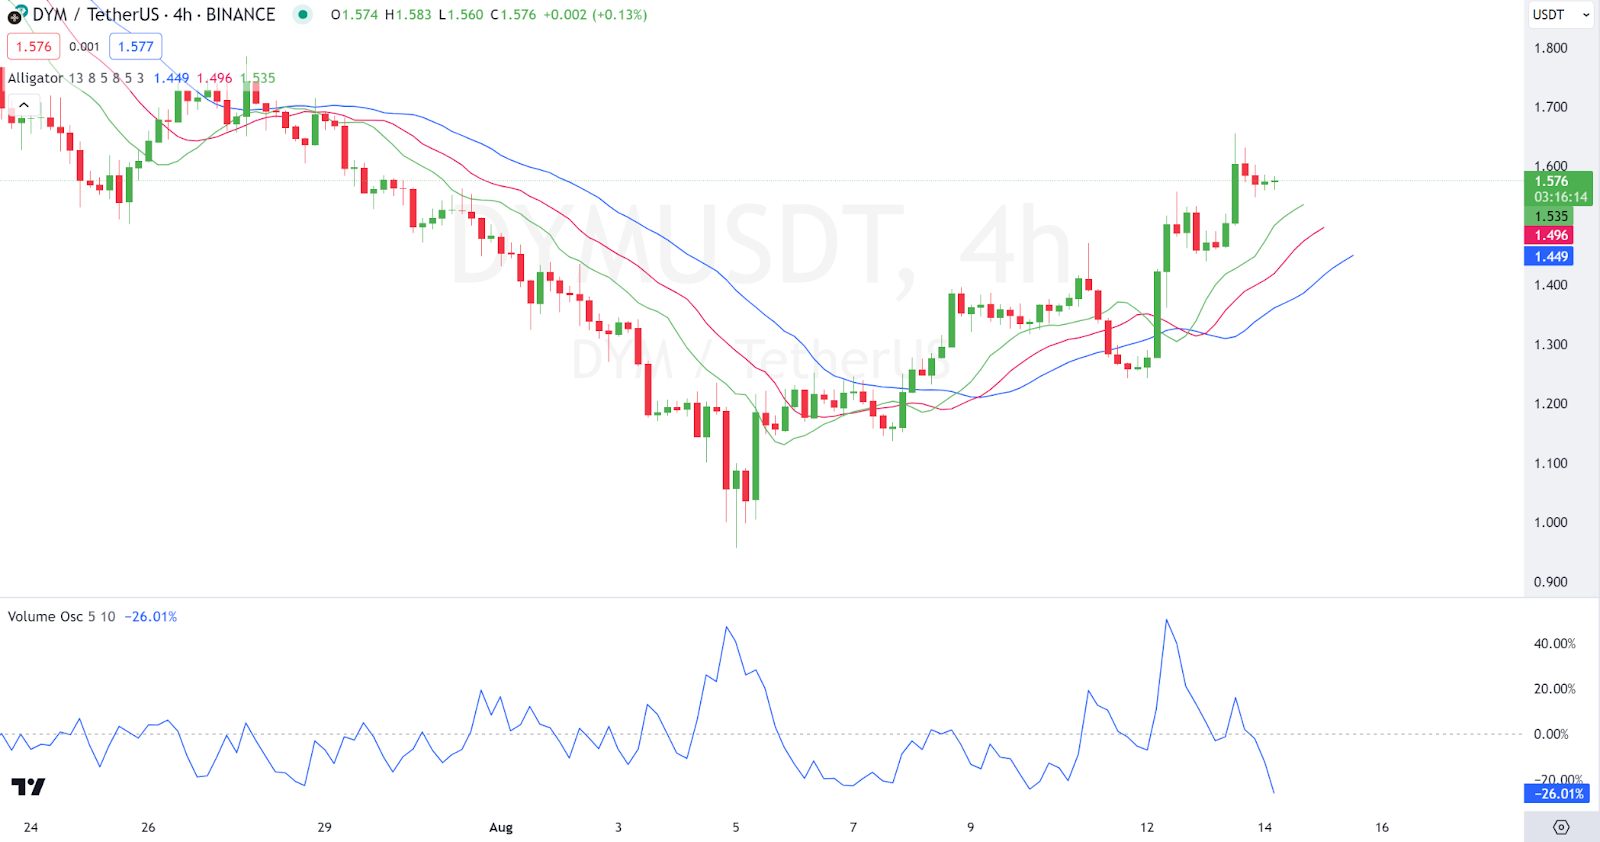
On the other hsnd, we see that the Volume Oscillator displayed at the bottom of the chart, indicates a decrease in volume by -26.01%. This declining volume during the recent consolidation suggests that the pullback might be a minor one, lacking strong bearish conviction. This level has been tested recently and represents a short-term ceiling for the price. A breakout above this level could pave the way for further gains, potentially targeting the $1.60 psychological level.
Dymension (DYM) Price Prediction – Bollinger Bands
Looking at DYM charts, we see that the price action has been characterized by a strong uptrend, as evidenced by the series of higher highs and higher lows, indicating sustained bullish momentum. The price is currently testing the upper Bollinger Band, indicating that the market is experiencing strong buying pressure. Typically, when the price reaches the upper band, it suggests that the asset may be overbought, and a pullback or consolidation could be expected. The bands have expanded significantly following a period of contraction, which often precedes a volatile price movement. The current widening of the bands confirms the recent upward volatility.
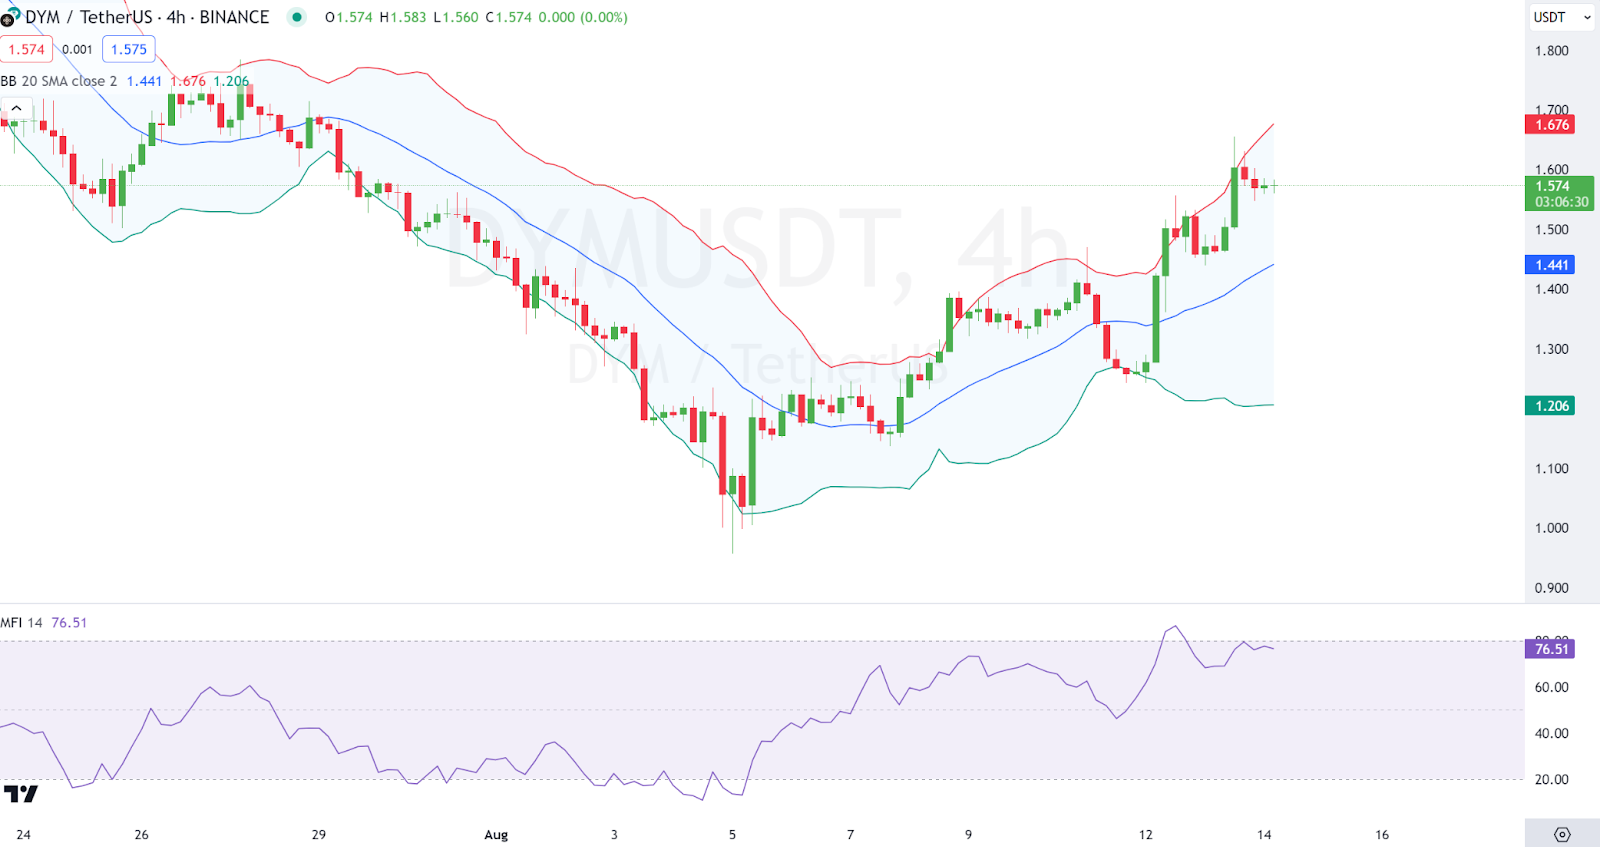
On the other hand, we see that the Money Flow Index (MFI) is currently at 76.51, which is above the 70 level, suggesting that the asset is in overbought territory. The MFI combines price and volume data to identify overbought or oversold conditions. The MFI’s high reading indicates that buying pressure has been strong, but the market might be due for a correction or consolidation. If the MFI begins to decline while the price remains flat or starts to fall, it could signal a potential reversal.
Dymension (DYM) Price Prediction – DYM in a Rising Wedge
Looking at other indicators, we see that the pair has been moving within an ascending channel, marked by higher highs and higher lows, which is indicative of a sustained bullish trend. The price is currently near the upper boundary of this channel, signaling a critical juncture where the market could either continue its upward momentum or face resistance. A breakout above the channel’s upper trendline could lead to accelerated gains, with potential targets higher in the channel. However, if the price fails to break through, a pullback toward the middle or lower part of the channel is possible.
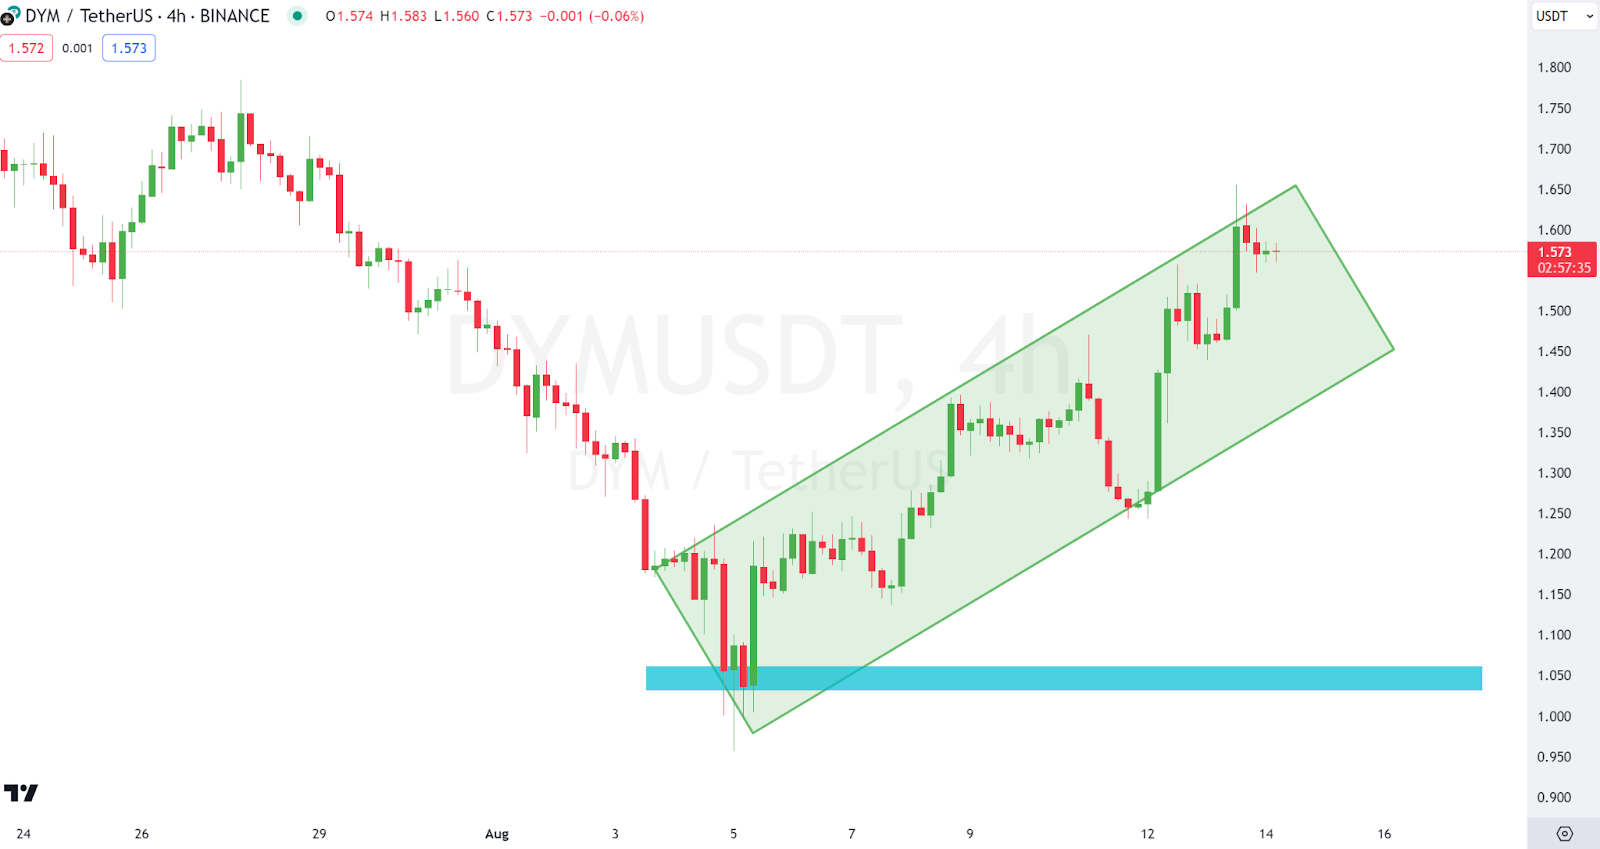
There is a significant support zone marked in blue, located around $1.050 to $1.100. This zone represents a previous area of consolidation and could act as strong support if the price were to break below the ascending channel. This area might attract buyers looking to capitalize on a potential dip. Generally, the market sentiment appears cautiously optimistic, with the price action suggesting continued upward momentum within the ascending channel. However, traders should be aware of the potential for a pullback, especially as the price approaches the upper boundary of the channel. The channel’s integrity is critical; as long as the price stays within it, the bullish outlook remains valid.
Dymension (DYM) Price Prediction – Ichimoku Cloud
Other indicators show that the DYM/USDT pair is currently trading within a narrow range, suggesting a period of consolidation after a recent upward movement. The price action is showing signs of indecision, as reflected by the small candlesticks near the current price. The Ichimoku Cloud is a comprehensive indicator that includes several components to assess market trends, momentum, and potential reversals. This line represents a short-term average and is currently below the price, indicating that the short-term momentum is bullish. It acts as immediate support in the event of a minor pullback. The Kijun-sen provides a longer-term perspective and is below the Tenkan-sen, reinforcing the bullish sentiment. This line also serves as a key support level.
On the other hand, we see that the Average Directional Index (ADX) is at 33.33, which indicates a strong trend. The ADX measures the strength of the trend rather than its direction. A reading above 25 is generally considered to indicate a strong trend, and the current value of 33.33 confirms the ongoing bullish momentum. Based on this chart, the market sentiment remains bullish, as indicated by the price’s position above the Ichimoku cloud and the strong ADX reading. However, the recent consolidation suggests that the market might be pausing before the next move. Traders should watch for a breakout above $1.583 to confirm the continuation of the upward trend.
Short-Term Prediction: 2024-2025
In the short term, Dymension is expected to continue its upward trajectory, driven by increasing adoption and technological advancements. The token could potentially reach a high of $1.60 by the end of 2024, with a low estimate of $1.30. In 2025, as the cryptocurrency market matures, Dymension might see its price rise to between $1.50 and $2.00.
Mid-Term Prediction: 2026-2028
As Dymension gains more recognition and integration into various blockchain-based applications, its price could see more substantial growth. By 2026, DYM could be trading within the $1.80 to $2.50 range. The year 2027 might bring further price appreciation, with potential highs reaching $3.00. By 2028, Dymension could be looking at a price range of $2.50 to $3.50.
Long-Term Prediction: 2029-2030
In the long term, Dymension’s continued development and expansion could see its price reaching new heights. By 2029, the token might trade between $3.00 and $4.00. By 2030, as the cryptocurrency market continues to evolve and mature, Dymension could potentially reach a high of $5.00, with a low estimate of $3.50.
Dymension (DYM) presents an exciting opportunity for investors, given its innovative approach and strong community support. While the cryptocurrency market is inherently volatile, the positive momentum surrounding Dymension suggests that it has the potential to grow significantly over the next few years.
Disclaimer: The information presented in this article is for informational and educational purposes only. The article does not constitute financial advice or advice of any kind. Coin Edition is not responsible for any losses incurred as a result of the utilization of content, products, or services mentioned. Readers are advised to exercise caution before taking any action related to the company.
 Price Prediction 2026-2030: Will TRX Hit $0.50 Soon?")
 Price Prediction 2026-2050: Will HYPE Hit $100 Soon?")


: What Happens If You Use an Unlicensed Platform?")