


- ETH bull strength is increasing as bears tire in recent hours.
- According to technical indicators, this bull trend is yet to reach its peak.
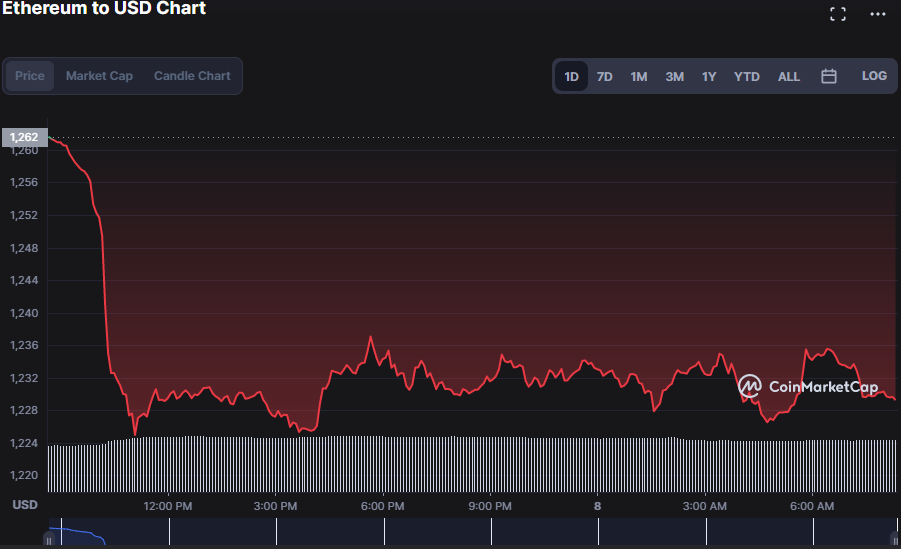
- The community wonders if there may be another breakout as prices move away from support level of $1,224.45.
Negative sentiment in Ethereum (ETH) has grown, with prices falling in the past day to trade below the $1,240 support level. Bulls, however, recently swooped in and seized control, driving prices up by 0.27% to $1,233.55.
This upward trend is bolstered by a 0.49% increase in market capitalization to $151,022,865,953. However, 24-hour trading volume declined 17.38% to $4,924,698,035 indicating that buyers are not matching sellers’ expectations.
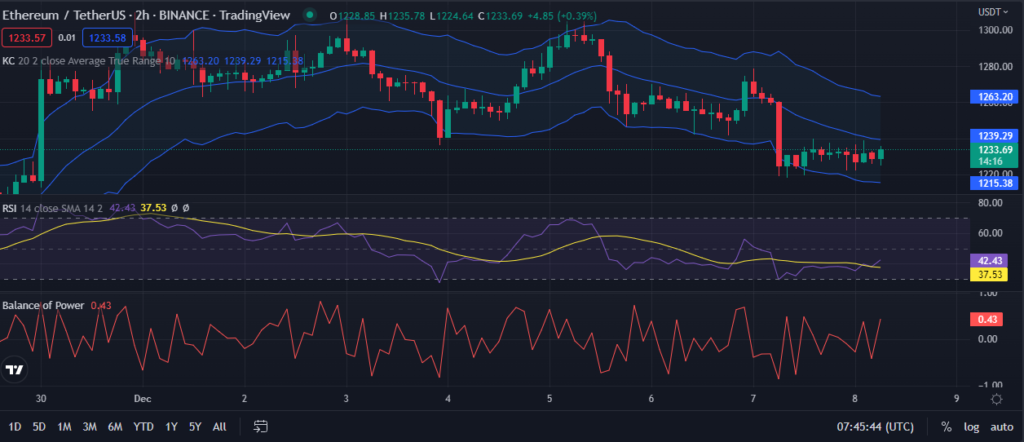
The movement of the Keltner Channel bands south shows that selling pressure is increasing. The ETH 2-hour price chart shows this, with the top band at $1263.14 and the lower band at $1215.54, both of which are declining. As the price moves toward the lower band, the positive momentum in the market is likely to fade, but the formation of a bullish engulfing candlestick gives traders hope for a bull run.
The Relative Strength Index (RSI) is traveling north, into the “50” zone, and above the signal line reading of 37.56 with a value of 43.63. This RSI movement backs up the idea that bulls are getting stronger as the market gets closer to being stable, which happens at the “50” level.
A selloff coupled with a rising Balance of Power (BOP) line denotes the end of bear dominance, and so bear dominance in ETH is dwindling since a cross-over above the “0” implies a buy. The upward trend on the 2-hour price chart, hinting that buyers may triumph, is reinforced by the BOP reading, which is in positive territory at 0.36, indicating an upward tendency.
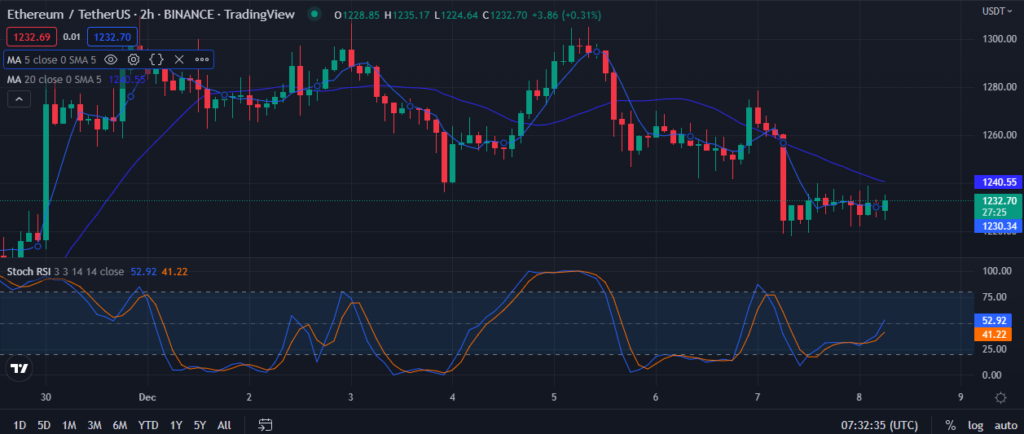
The onset of bear vigor is signaled by the collapse of the shorter-term MA below the longer-term MA, as seen in the ETH price chart, where the 5-day MA is 1230.40 and the 20-day MA is 1240.54. When the price goes below both MAs, it strengthens the bearish trend on the ETH market and suggests that the bulls might not be in charge for long.
The stochastic RSI, which is presently reading 53.67, is approaching overbought territory of “80,” indicating that bull strength is increasing and buying and selling forces are equalizing. This stochastic RSI movement provides traders with some optimism for a bull run.
On the ETH market, the downbeat trend has been invalidated, and if bulls can hold the barrier level, this bull trend will continue.
Disclaimer: The views and opinions, as well as all the information shared in this price analysis, are published in good faith. Readers must do their own research and due diligence. Any action taken by the reader is strictly at their own risk, Coin Edition and its affiliates will not be held liable for any direct or indirect damage or loss.
Disclaimer: The information presented in this article is for informational and educational purposes only. The article does not constitute financial advice or advice of any kind. Coin Edition is not responsible for any losses incurred as a result of the utilization of content, products, or services mentioned. Readers are advised to exercise caution before taking any action related to the company.


