


- Ethereum price analysis shows a negative market sentiment.
- ETH found support at around $1,451.56.
- Ethereum’s price dropped by 8% this Friday.
The Ethereum price fell sharply on Friday, dropping by more than 8.15% from its recent highs. The decline comes after sharp gains that saw the cryptocurrency touch highs of $1,760. Ethereum found support at around $1,451.56 and has since been consolidating in a narrow range.
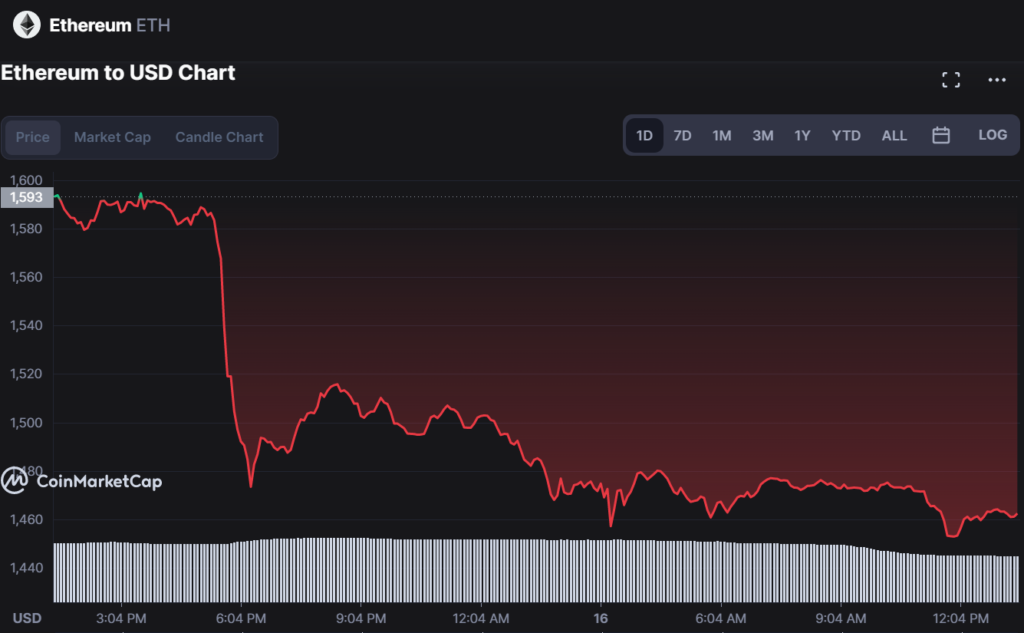
The price drop might be attributed to the Merge as the Ethereum Network shifted from proof of work to proof of stake, which caused speculations in the market. The bulls might have been scared off by the event, leading to a sharp price drop. Some selling action developed as the market attempted to find a new equilibrium.
The merge brought about some changes in the Ethereum network, most notably, the shift from proof of work to proof of stake. The difference is designed to improve the scalability and security of the Ethereum network. However, it remains to be seen how this will affect prices in the future.
Ethereum seems to be in a consolidation phase as it tests critical support and resistance levels. A breakout above $1,600 could see the price continue its uptrend. However, a breakdown below $1,400 could signal further losses in the short term.
Ethereum price analysis on the 4-hour chart indicates the prices have held above the $1.460 level in the last few hours. The bears have been adamant in pushing prices lower but have been unable to break the critical support at $1.460. The bulls need to make prices above $1.600 to continue the uptrend.
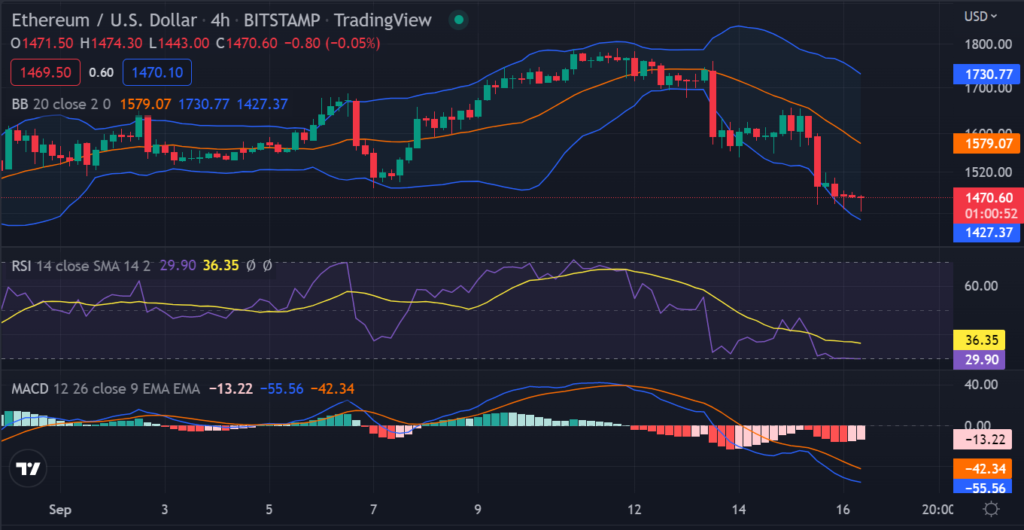
The market volatility is currently high, as indicated by the bulging Bollinger bands. The upper band of the Bollinger band indicator is at $1,704, while the lower band is at $1,444. A breakout from the current consolidation phase could see prices move in either direction.
The RSI is below the 29 levels, showing oversold conditions in the market. This means the market is ripe for a rebound to the upside. The MACD shows that the downward trend is losing momentum as the MACD line starts to move above the signal line. A crossover could see prices resume their uptrend.
Meanwhile, the daily chart shows a clear declining trendline, with prices currently testing the $1,460 support line. A breakdown of this support line could see prices decline to $1,400. On the other hand, a breakout above the trendline could see prices move higher towards $1,600.
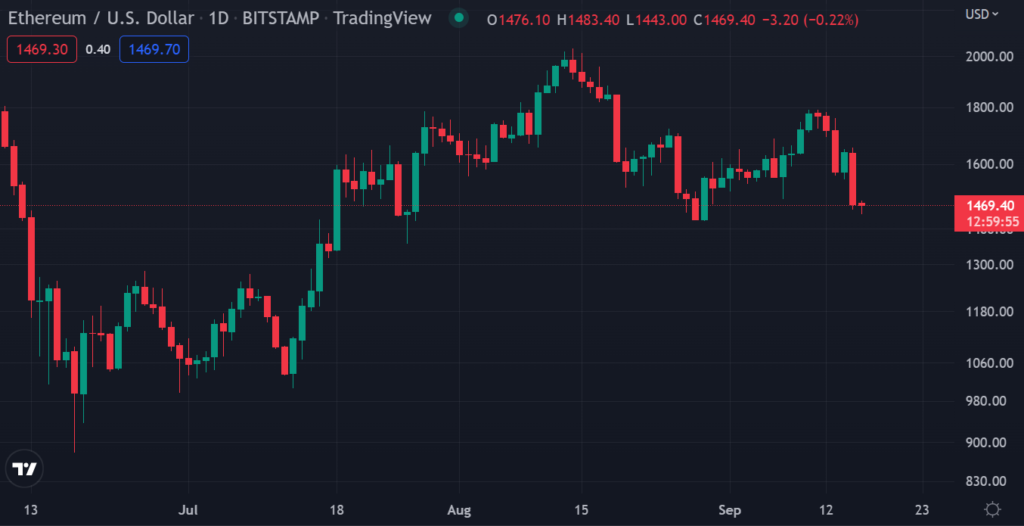
Overall, the market sentiment will likely remain bearish in the short term as prices continue to fall. As a result, Ethereum could find support at around $1,400 in a short time.
Disclaimer: The information presented in this article is for informational and educational purposes only. The article does not constitute financial advice or advice of any kind. Coin Edition is not responsible for any losses incurred as a result of the utilization of content, products, or services mentioned. Readers are advised to exercise caution before taking any action related to the company.
 Price Prediction 2026-2030: Will LTC Hit $80 Soon?")


 Price Prediction 2026, 2027, 2028, 2029, 2030-2050")
