


- Bearish pressure challenges ETH, but positive signals hint at a $1,700 rebound.
- Despite the market dip, ETH sees increased trading activity, reflecting ongoing interest.
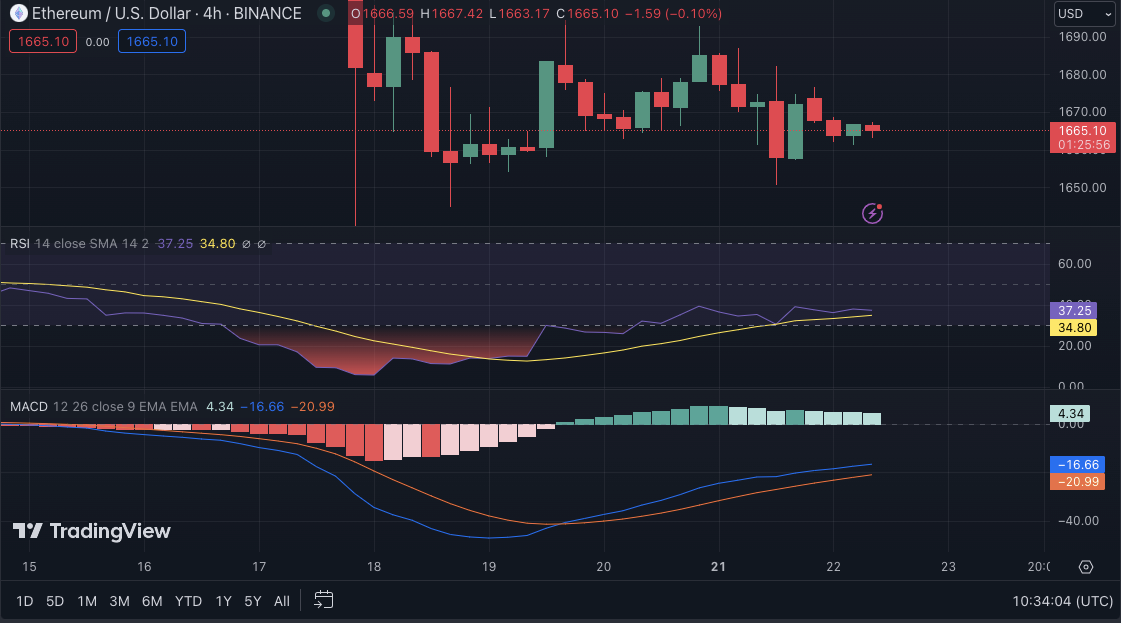
- RSI, MACD, and CMF signal potential ETH price recovery and bullish momentum.
In the previous 24 hours, bearish pressure has prevailed in the Ethereum (ETH) market, with the price falling from an intraday high of $1,679.76 to an intraday low of $1,651.96. This negative trend can be attributable to a mix of investor profit-taking and a broader market correction. ETH was trading at $1,665.11 at publication, indicating a small rebound from its intraday low.
If negative momentum breaks through the $1,651.96 support level, the next level to watch for is around $1,620. However, if the market mood turns and bullish momentum takes hold, ETH might reclaim its prior highs and target the $1,700 barrier level.
During the bear market, ETH’s market capitalization decreased to $200,164,575,545, while its 24-hour trading volume climbed by 7.87% to $4,621,631,140. Despite the reduction in market capitalization, the increase in trading volume demonstrates that there is still interest and activity in ETH.

On the ETH/USD price chart, the Relative Strength Index (RSI) is 37.04 and pointing higher, indicating the possibility of a positive reversal soon. This pattern shows that ETH may have enough momentum to reclaim its prior highs and even break over the $1,700 barrier level. Furthermore, a rise in trade volume under unfavorable market circumstances might indicate greater purchasing pressure and probable investor accumulation.
The Moving Average Convergence Divergence (MACD) trend is positive, with a score of -16.72, indicating a probable shift in momentum toward the bullish side. If the MACD blue line moves into the positive zone, it might mean a stronger bullish trend and support the potential of breaking past the $1,700 barrier level.
Adding to the bullish reversal potential, the Chaikin Money Flow (CMF), despite a reading of -0.08, is improving and approaching positive territory. This pattern shows that purchasing pressure is building, perhaps fuelling the market’s bullish momentum. If the CMF remains in positive territory and crosses over the zero line, it might confirm the increasing purchasing pressure and enhance the bullish picture.
With a Know Sure Thing (KST) rating of -35.4196 and advancing above its signal line, the market indicates a possible bullish trend reversal. The KST is a momentum indicator that gauges the rate of change of price movements; a move above the signal line means that positive momentum is gaining traction. If the KST continues to rise, it may provide evidence of the market’s increasing optimistic mood.

In conclusion, Ethereum’s price outlook appears to be gaining positivity despite recent setbacks, with technical indicators suggesting potential for a bullish trend reversal.
Disclaimer: The views, opinions, and information shared in this price prediction are published in good faith. Readers must do their research and due diligence. Any action taken by the reader is strictly at their own risk. Coin Edition and its affiliates will not be liable for direct or indirect damage or loss.
Disclaimer: The information presented in this article is for informational and educational purposes only. The article does not constitute financial advice or advice of any kind. Coin Edition is not responsible for any losses incurred as a result of the utilization of content, products, or services mentioned. Readers are advised to exercise caution before taking any action related to the company.


