
- Ethereum is rallying today, with its price up over 2.4% and volume surging 17%
- Analysts say the rally is fueled by a chart pattern that mirrors its 2021 bull run
- Renewed demand is shown by a rebounding RSI and weakening bearish momentum on the MACD
Ethereum’s price chart is showing a striking similarity to its 2021 market structure, leading some analysts to believe history may be about to repeat with a major price surge later this year. Analyst Gordon (@AltcoinGordon) was among the first to highlight the repeating pattern, pointing to a setup that preceded a massive bull run three years ago.
Is Ethereum Repeating Its 2021 Price Pattern?
The analysis centers on a specific sequence: a “Dead Cat Bounce” followed by a “Final Retest” of a key support level. In 2021, Ethereum went through this exact pattern when it retested support near $250.
After holding that level, ETH began an explosive rally that pushed it past $4,000 by the year’s end. Gordon’s current chart analysis suggests a similar dynamic is now in play, with Ethereum retesting a major support zone around the $2,000 mark.
Related: Is Ethereum Below $2,400 a “Steal”? Analyst Predicts Surge Toward All-Time High
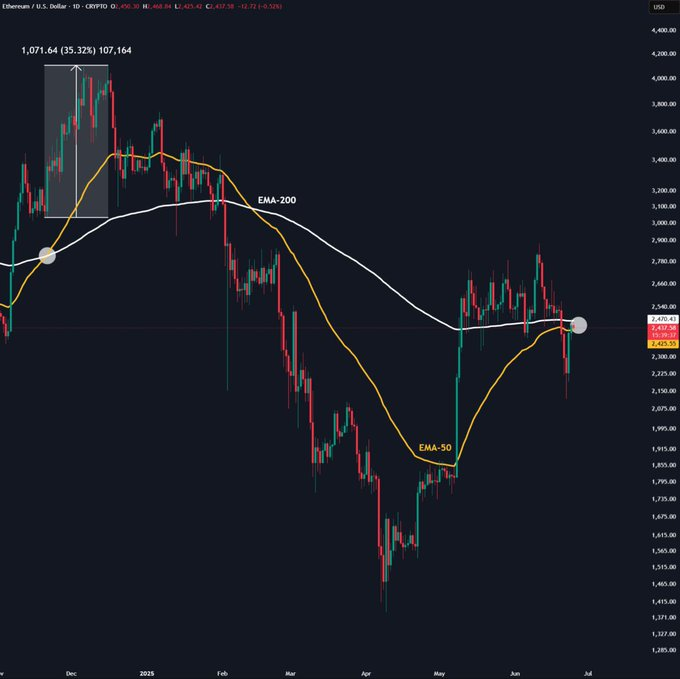
Analyst Highlights Moving Average Crossovers
Further insight comes from crypto analyst Cipher X, who points to Ethereum’s daily chart showing key moving averages. Cipher X notes that the 50-day exponential moving average (EMA) is nearing a crossover with the 200-day EMA, a technical event closely watched for trend signals.
While a 50-day EMA crossing below the 200-day EMA often signals bearish momentum, Cipher X observes that Ethereum’s recent price action varies from regular patterns seen in Bitcoin. For instance, after golden crosses in 2024, ETH posted gains of approximately 35% within four weeks, including a rally above $4,000 in early 2024.
Related: Here’s Why Ethereum’s Price Keeps Hitting a Wall, According to the Data
Market Data Indicates Renewed Activity
Current market data supports a cautiously optimistic outlook. As of press time, Ethereum was trading at $2,491.92, up by 2.46% on the day. Market capitalization increased by 2.49% to $300.82 billion, while 24-hour trading volume surged 17.24% to $19.78 billion.
Additionally, technical momentum indicators show that the Relative Strength Index (RSI) currently stands at 50.54, above the neutral midpoint of 50, indicating a balance between buying and selling pressure. The RSI’s recent rebound from oversold levels near 30 signals renewed demand in the market.
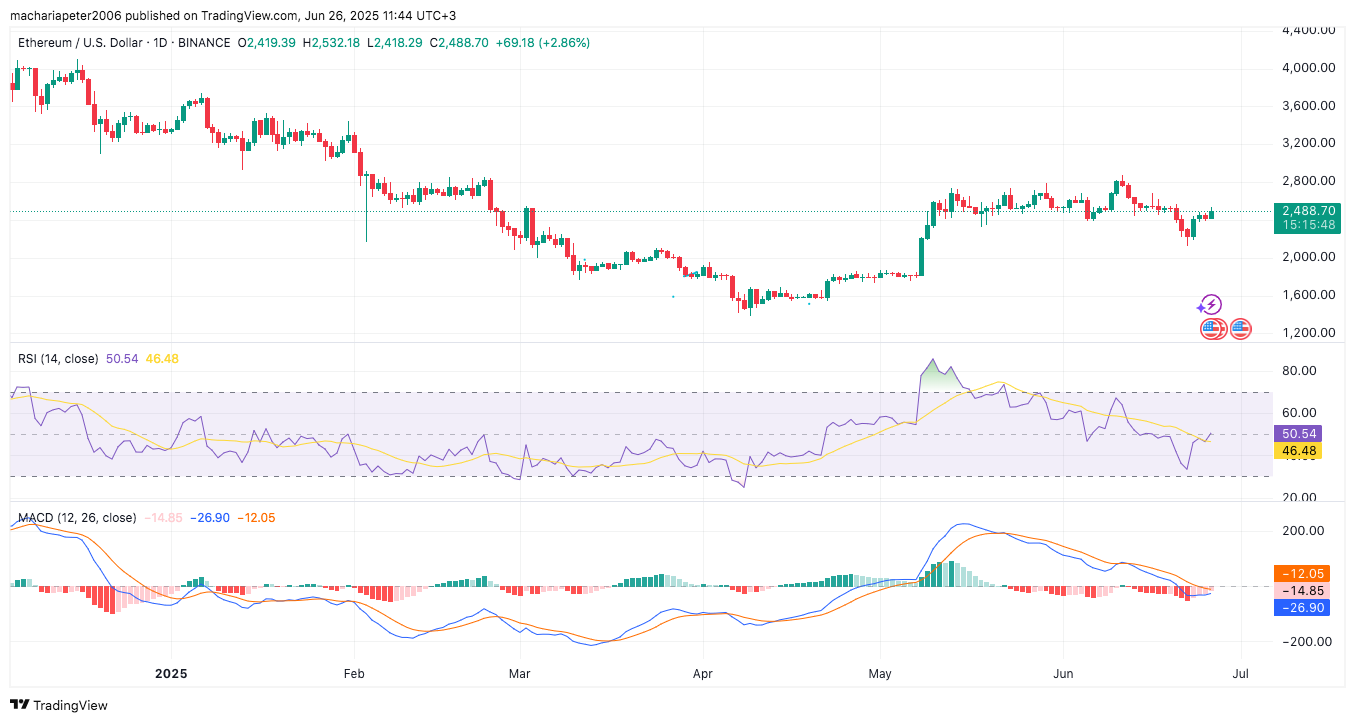
Meanwhile, the Moving Average Convergence Divergence (MACD) remains negative but shows declining bearish momentum. Cipher X highlights that the narrowing MACD histogram red bars may signal an impending bullish crossover, which traders typically interpret as a sign of upward price movement.
Disclaimer: The information presented in this article is for informational and educational purposes only. The article does not constitute financial advice or advice of any kind. Coin Edition is not responsible for any losses incurred as a result of the utilization of content, products, or services mentioned. Readers are advised to exercise caution before taking any action related to the company.


