


- Lookonchain tweeted that 88k ETH was deposited while 32.6k was withdrawn in the last 24 hours.
- The blockchain tracking firm also shared that an ETH whale staked 16.8k ETH yesterday.
- At press time, ETH’s price is up more than 2% over the last 24 hours.
In a tweet made this morning, the blockchain tracking firm Lookonchain shared that there has been a fair amount of deposits and withdrawals for Ethereum (ETH) over the last 24 hours. According to the post, there was a total of 88k ETH deposited and 32.6k withdrawn from exchange platforms in the past day.
Lookonchain’s latest tweet also highlighted the transaction activity of one particular whale, which had withdrawn 16,989 ETH from OKX, Bitfinex, Bitstamp and Kraken exchanges collectively. The whale then proceeded to stake 16,800 ETH.
The price of ETH has risen 2.36% over the last 24 hours according to CoinMarketCap – taking the altcoin leader’s price to $1,867.04 at press time. There has also been an increase in the crypto’s daily trading activity. Currently, the total 24-hour trading volume for ETH is estimated to be $8,927,787,616, which is a 12.22% increase in the past day.
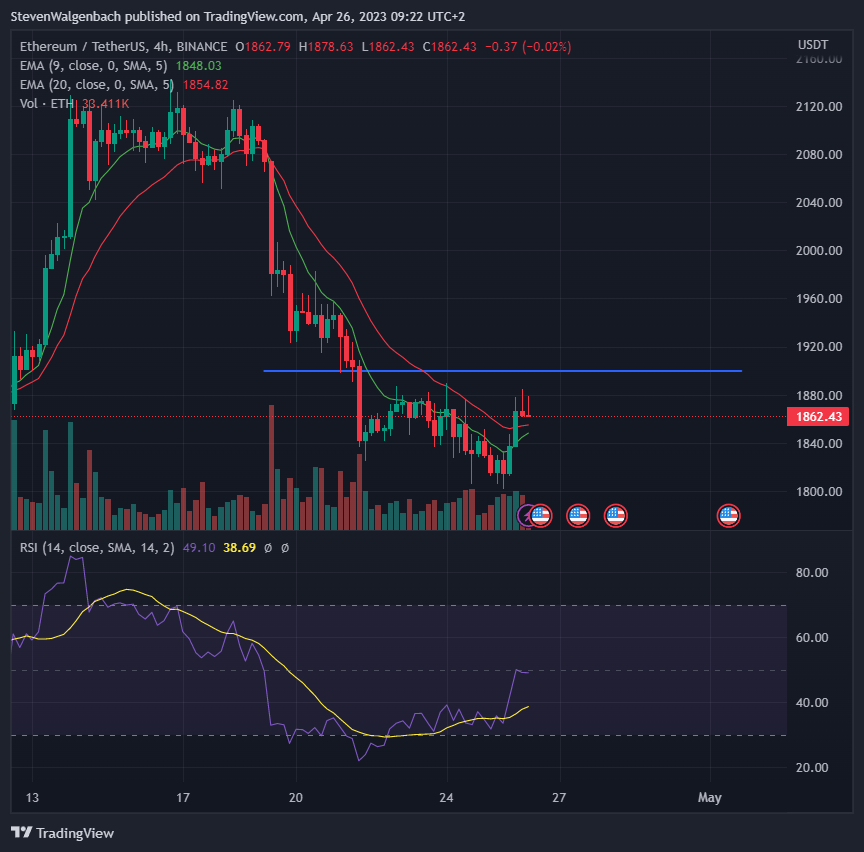
ETH’s price has been able to rise above the 9 and 20 EMA lines on its 4-hour chart and continues to trade above the two key EMA lines at press time. The altcoin’s price is attempting to break above the major $1,900 resistance level, but bears are doing everything in their power to keep ETH’s price below $1,900.
Despite the overwhelming sell pressure from bears, technical indicators on ETH’s 4-hour chart are still currently flagging bullish. At press time, the RSI line on ETH’s 4-hour chart is trading above the RSI SMA line. Furthermore, the RSI line on ETH’s 4-hour chart is parallel to the horizontal axis.
In addition to the bullishness seen in the RSI indicator, the 9 EMA line on ETH’s 4-hour chart is also closing in on the 20-day EMA line. Should the 9 EMA on ETH’s 4-hour chart cross above the 20 EMA line, it will trigger a significant bullish flag for the altcoin. This bullish flag will also serve as an early indication of ETH’s price breaching $1,900 in the following 24-48 hours.
Disclaimer: The views and opinions, as well as all the information shared in this price analysis, are published in good faith. Readers must do their own research and due diligence. Any action taken by the reader is strictly at their own risk. Coin Edition and its affiliates will not be held liable for any direct or indirect damage or loss.
Disclaimer: The information presented in this article is for informational and educational purposes only. The article does not constitute financial advice or advice of any kind. Coin Edition is not responsible for any losses incurred as a result of the utilization of content, products, or services mentioned. Readers are advised to exercise caution before taking any action related to the company.
 Price Prediction 2026, 2027, 2028, 2029, 2030-2050")
 Price Prediction 2026, 2027, 2028, 2029, 2030-2050")


