 Price Prediction for July 15")
Ethereum price has climbed back above the $3,000 threshold after a decisive breakout past multiple resistance zones. As of July 14, Ethereum price today is holding near $3,046, registering a 2.5% gain over the last 24 hours. The rally is underpinned by both structural bullish shifts and accelerating demand in derivatives markets.
What’s Happening With Ethereum’s Price?
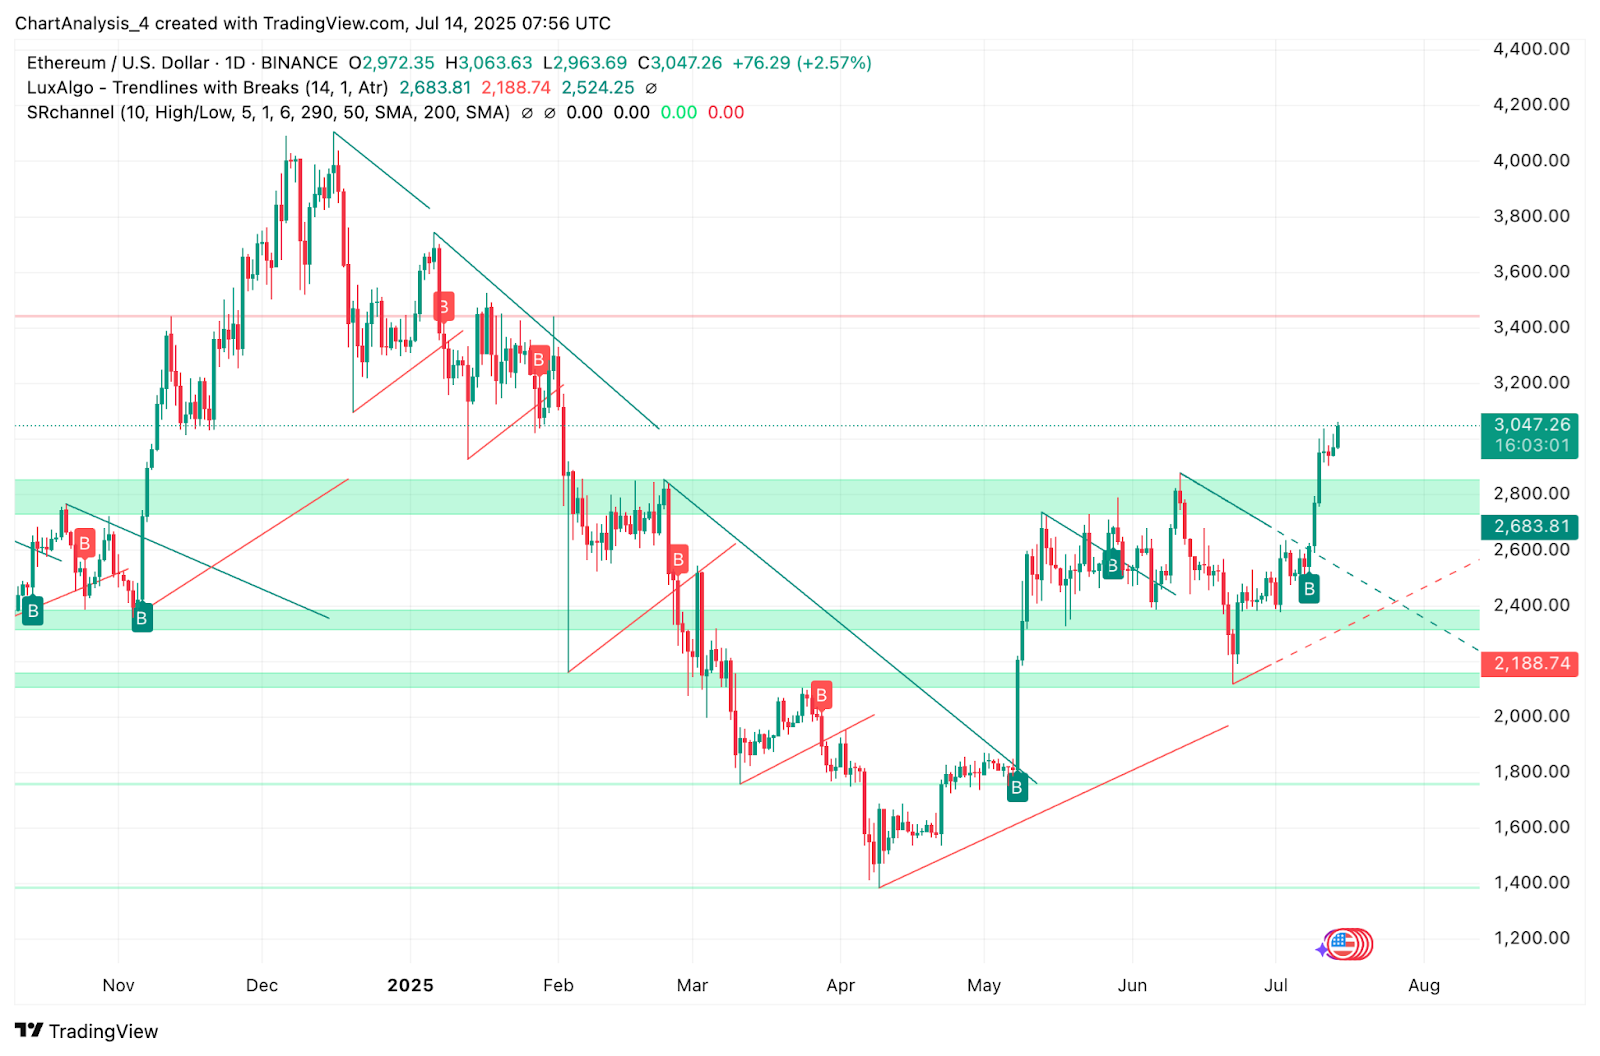
The daily chart shows Ethereum price breaking out of a multi-month accumulation range between $2,400 and $2,800, triggering a clean bullish structure shift. ETH price has now reclaimed the $2,970–$3,000 supply block that capped advances in June and early July. The current structure shows ETH forming higher highs and higher lows, with the price now trading above the May swing high.
Ethereum price has also cleared a major descending trendline that extended from the November 2024 high, signaling a reversal in broader trend direction. The breakout is supported by visible volume strength and a strong base formed near the $2,680–$2,700 demand block.
The 4-hour Bollinger Bands confirm a renewed volatility cycle. Price is pushing above the upper band while maintaining support from the 20/50 EMA cluster between $2,945 and $2,814. As long as ETH stays above the mid-band ($2,972), the trend remains bullish.
Why Ethereum Price Going Up Today?
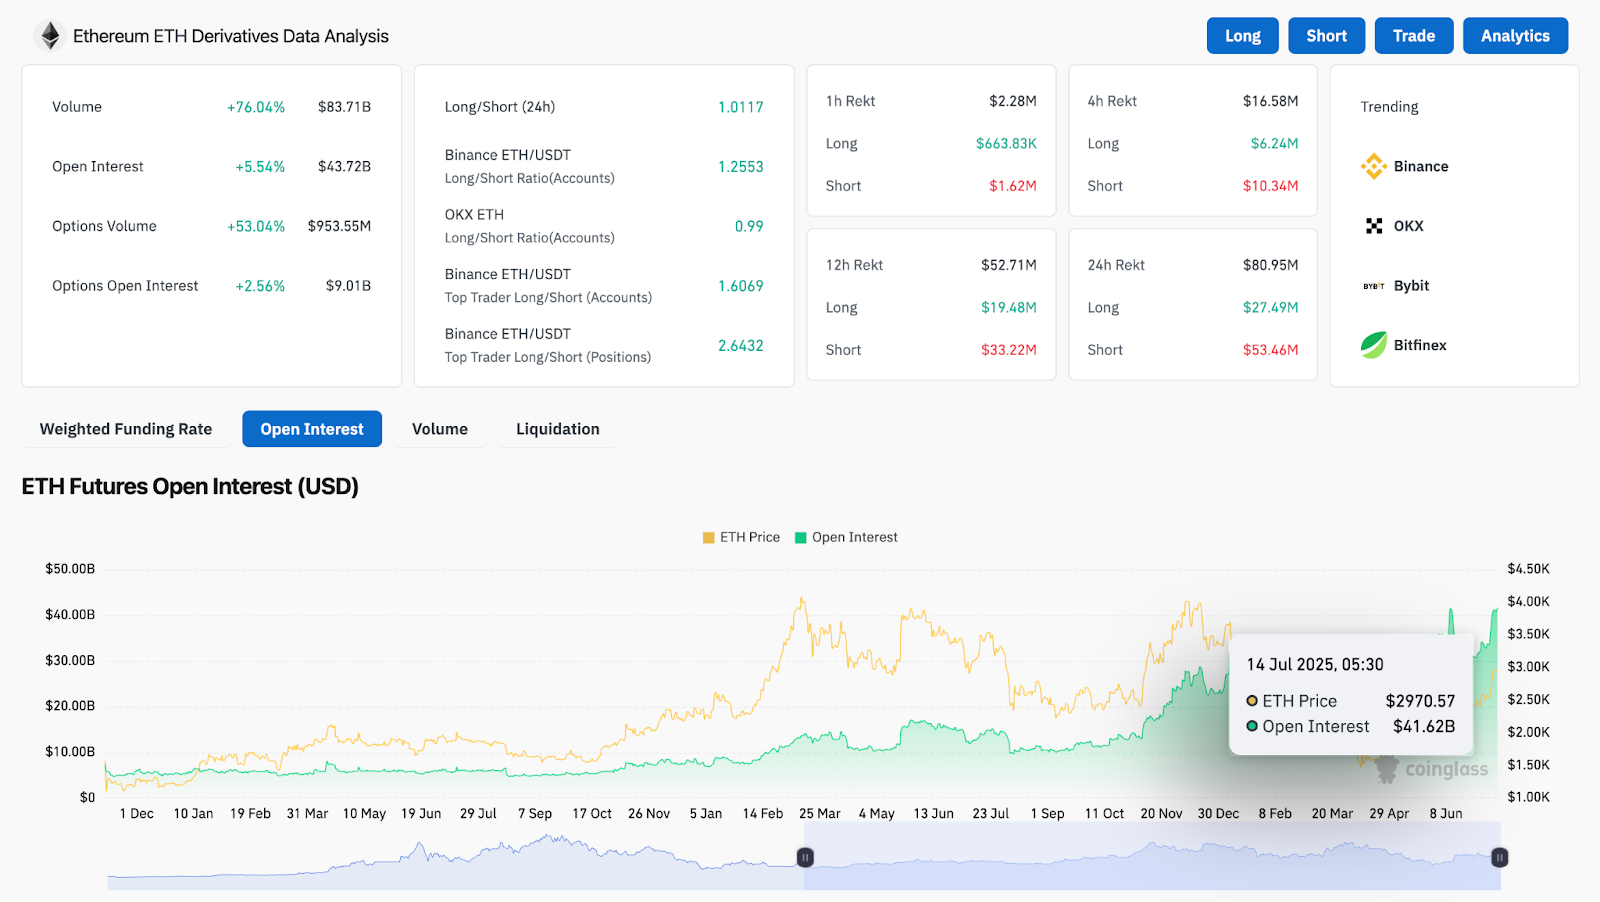
The recent rise in Ethereum price is fueled by strong derivatives activity and technical breakout signals. According to Coinglass data, open interest in ETH futures rose 5.54% in the last 24 hours to $43.72 billion. Total volume surged 76%, with options volume increasing by over 53%. Binance’s long/short ratio stands at 1.61 among top traders, and the top position ratio has climbed to 2.64, reflecting broad long bias.
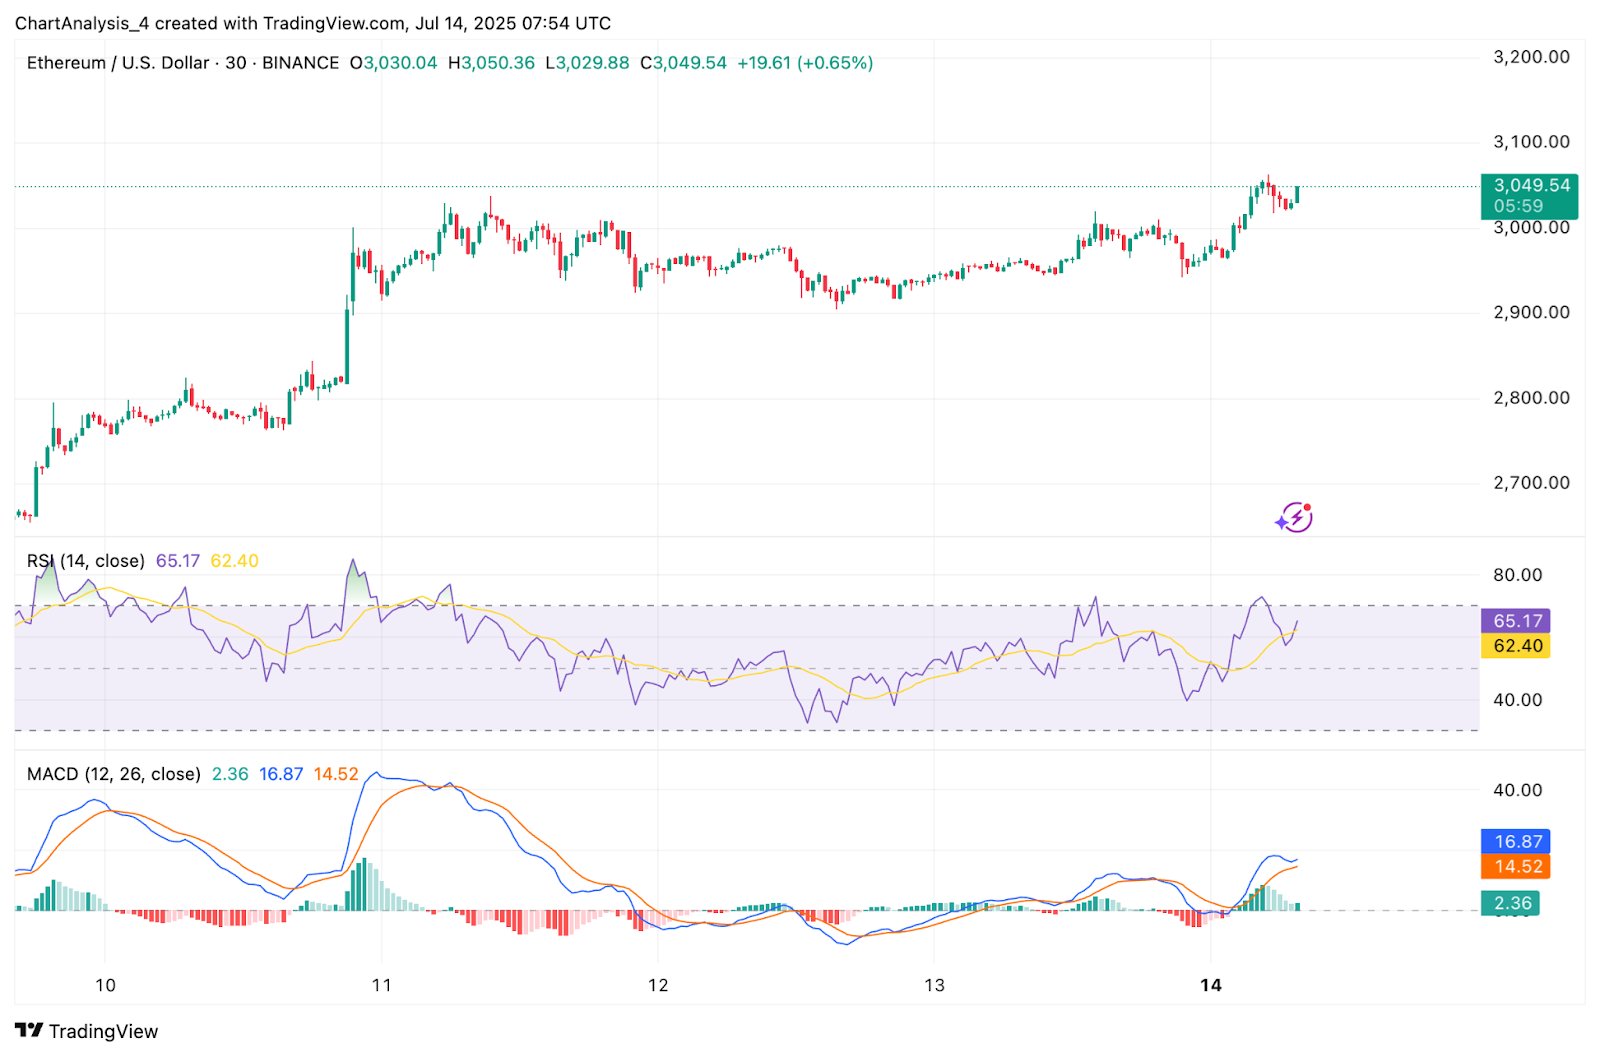
From a price action perspective, the 30-minute chart shows bullish continuation after a shallow pullback to $3,030. The RSI has bounced to 65.1, moving away from neutral territory. MACD is also printing a positive crossover with widening histogram bars, indicating fresh buying momentum.
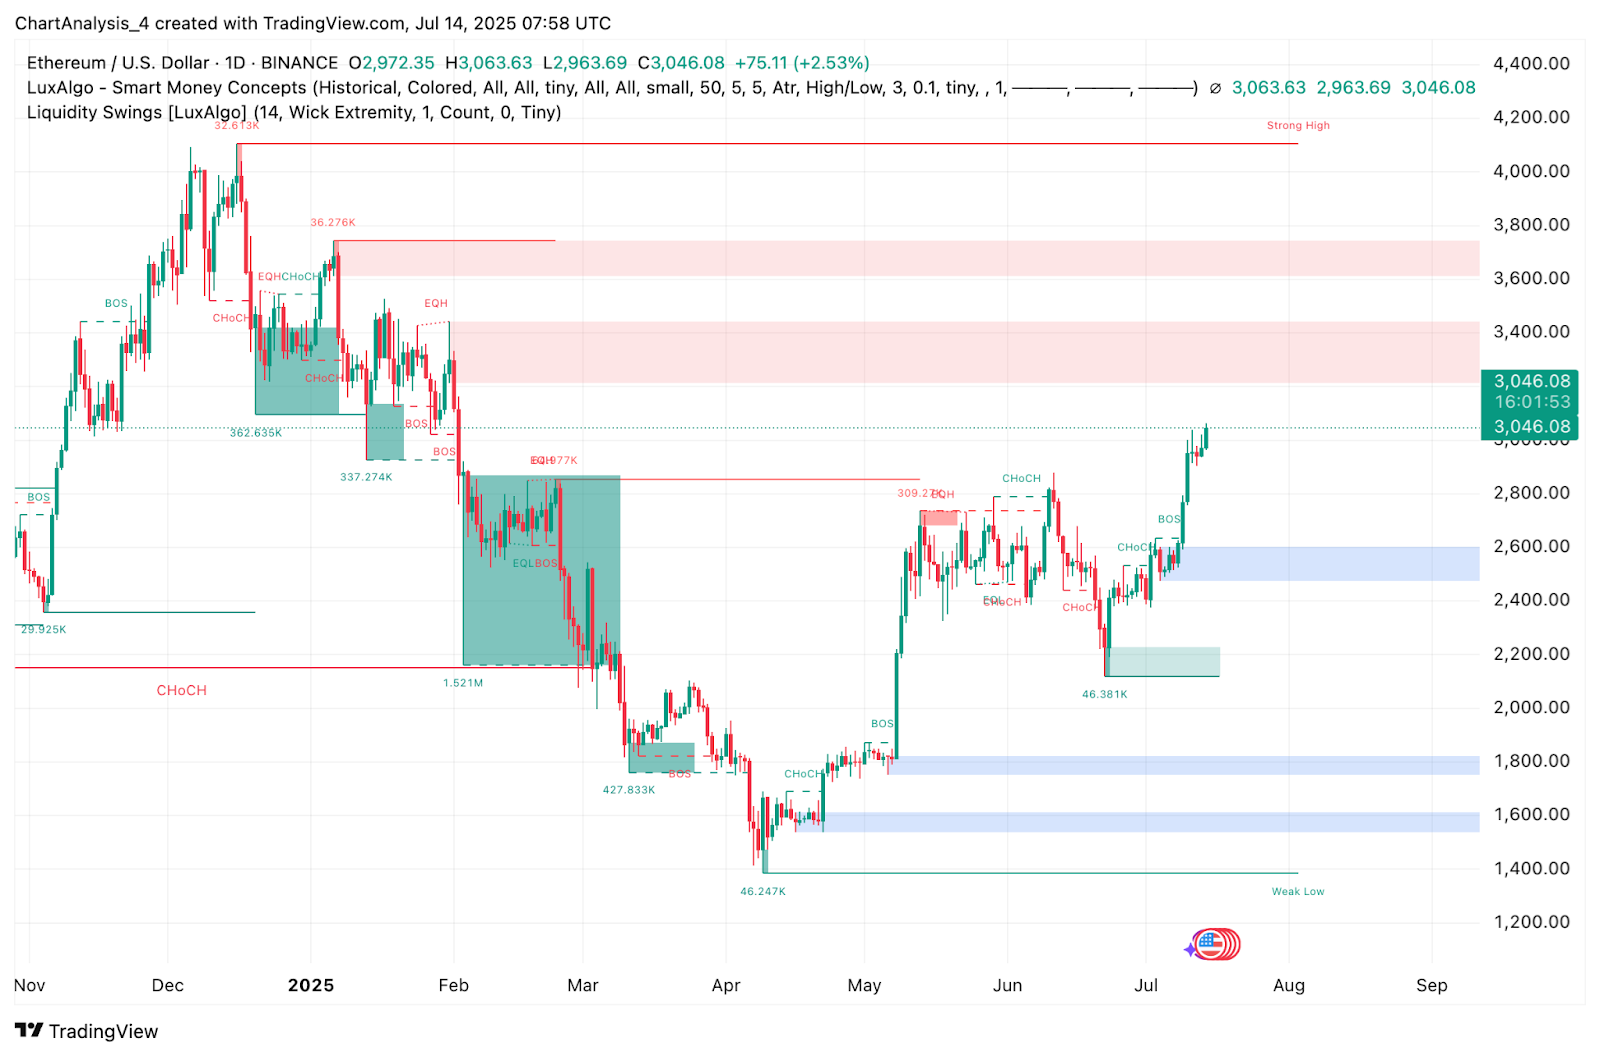
On the Smart Money Concepts (SMC) chart, ETH has broken key CHoCH levels and reclaimed BOS zones above $2,900. The current push through $3,000 is entering a low-liquidity zone up to $3,260, which could support rapid price acceleration.
Price Indicators Signal Acceleration Toward 0.618 Fib Level
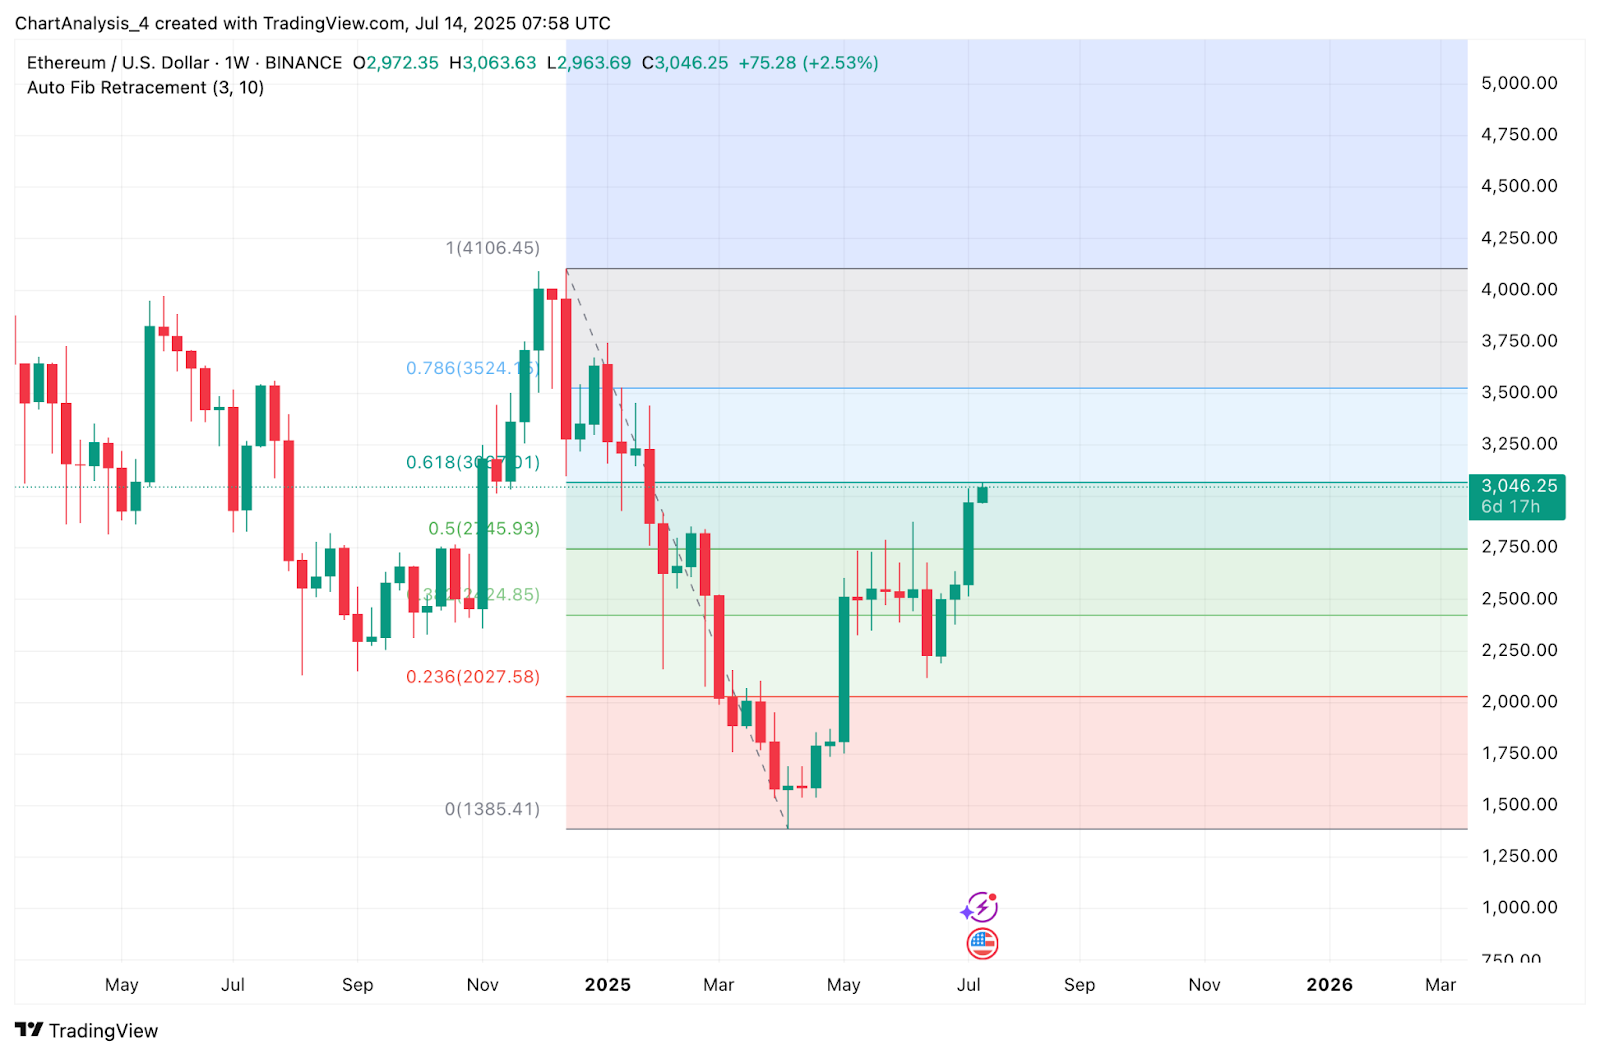
The weekly Fibonacci retracement from the $4,106 top to the $1,385 low shows that Ethereum price is now testing the critical 0.618 retracement level at $3,061. A confirmed weekly close above this mark would signal broader trend reversal potential, targeting $3,524 (Fib 0.786) as the next upside zone.
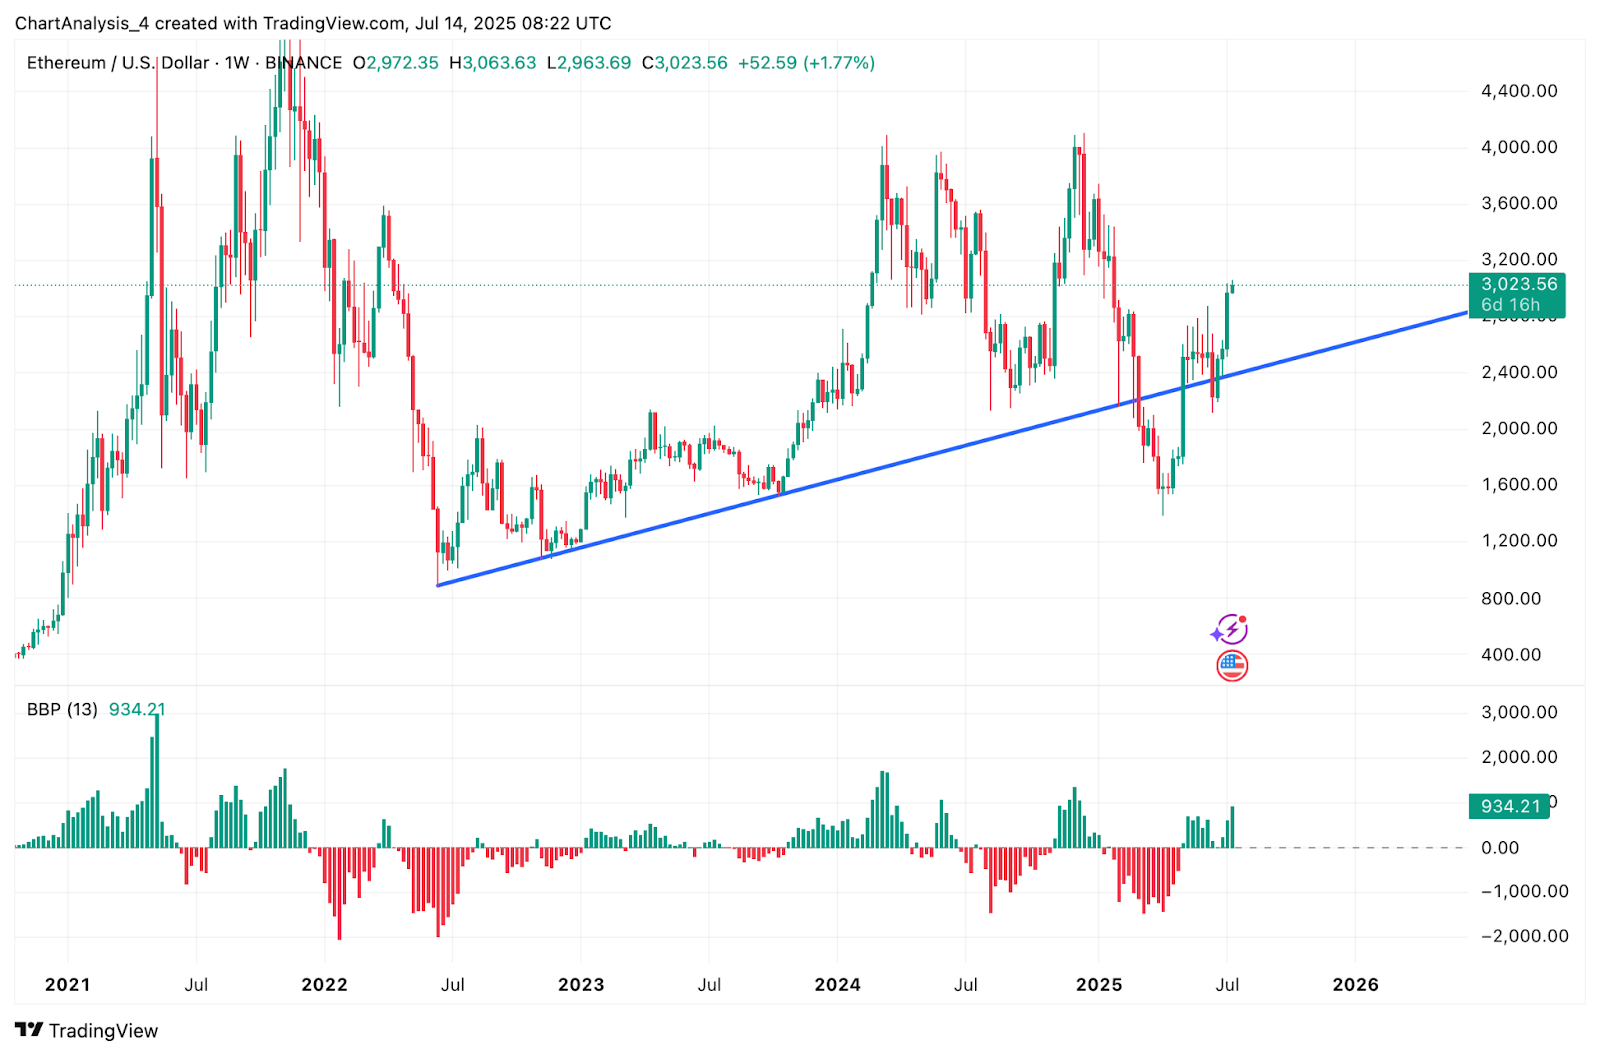
The daily RSI remains in bullish territory without signaling extreme overbought conditions, and the BBP (Bull Bear Power) on the weekly chart continues to rise, indicating healthy underlying trend strength.
The structure also aligns with the long-term ascending trendline extending from the 2022 cycle lows. ETH price has reclaimed this trendline and flipped it into dynamic support, further confirming the current upside breakout as a potential trend resumption.
ETH Price Prediction: Short-Term Outlook (24H)
Ethereum price may test the $3,061 resistance (Fib 0.618) over the next 24 hours. A clean close above this level could ignite a run toward $3,260 and $3,524, especially if volume remains elevated and funding rates stay neutral to positive.
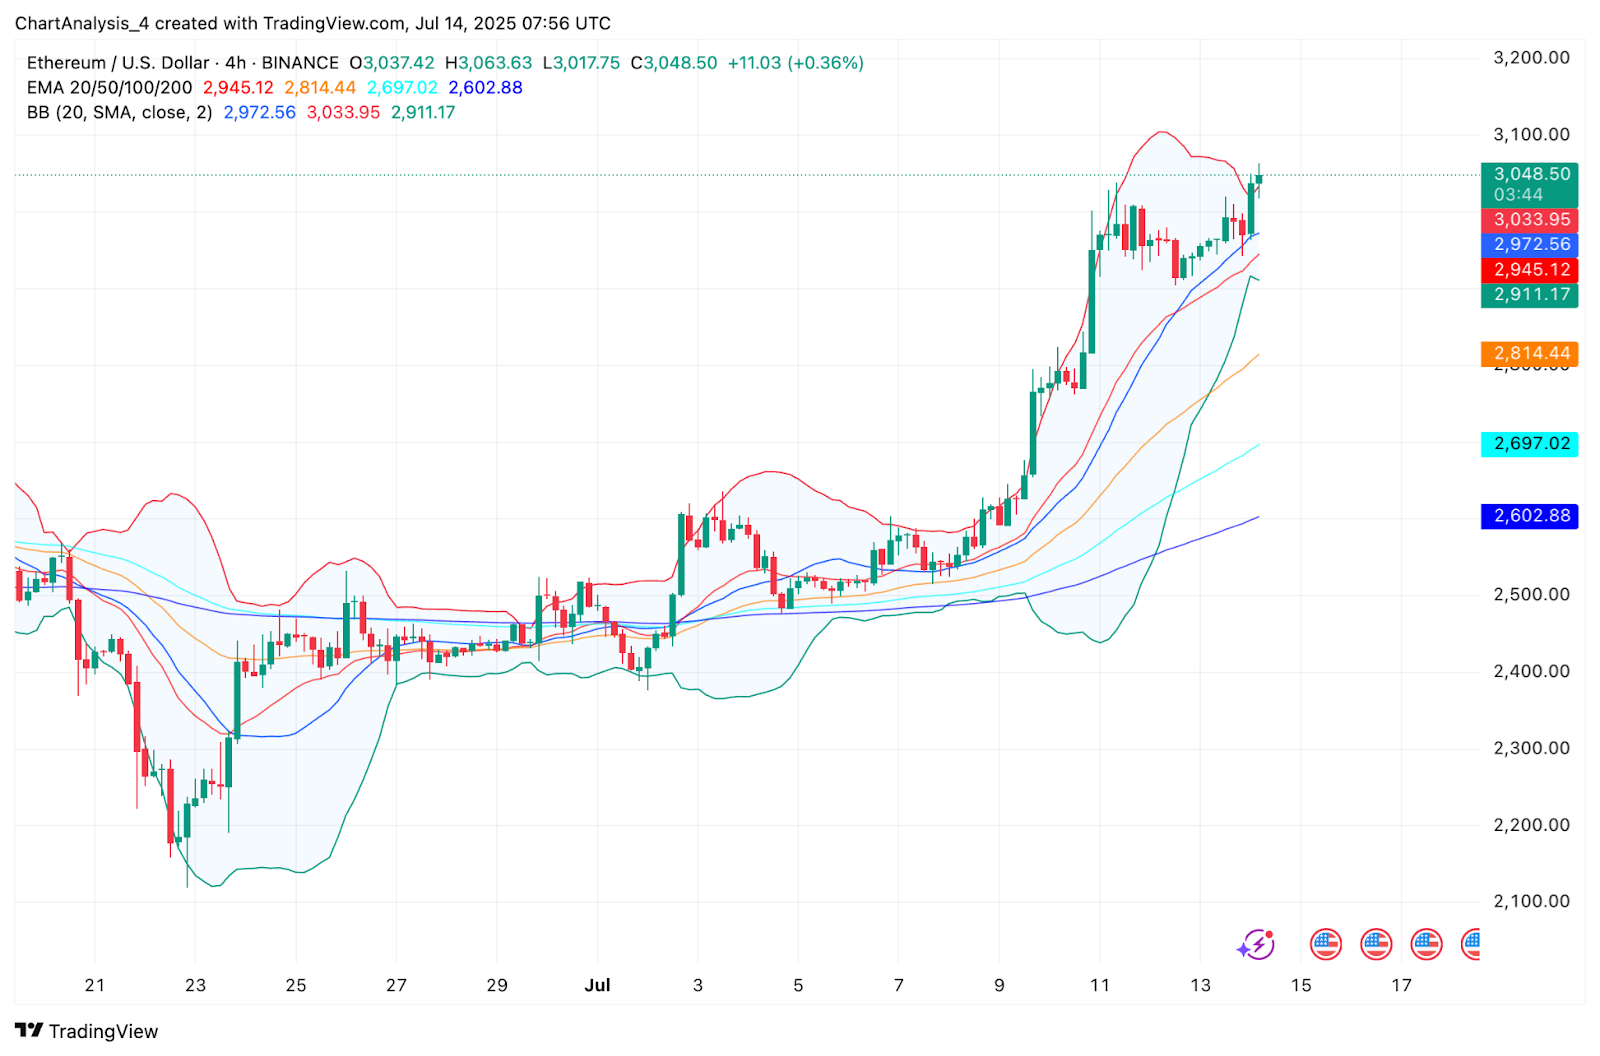
In the short term, if price dips below $3,000 again, the first support lies at $2,972 (Bollinger mid-band) followed by $2,945 (EMA20 4H) and then $2,814 (EMA50 4H). A breakdown below $2,814 would risk invalidating the bullish bias and invite a pullback toward $2,700.
However, given current RSI-MACD alignment, rising open interest, and bullish market structure, Ethereum looks poised to attempt continuation above $3,061 with short-term volatility likely to remain elevated.
Ethereum Price Forecast Table: July 15, 2025
| Indicator / Zone | Level / Signal |
| Ethereum price today | $3,046 |
| Resistance 1 | $3,061 (Fib 0.618 Weekly) |
| Resistance 2 | $3,260 (Low-liquidity zone) |
| Resistance 3 | $3,524 (Fib 0.786) |
| Support 1 | $2,972 (BB mid-band 4H) |
| Support 2 | $2,945 (EMA20 4H) |
| Support 3 | $2,814 (EMA50 4H) |
| RSI (30-min / 4H) | 65.1 / 62.4 (bullish momentum building) |
| MACD (30-min) | Bullish crossover, expanding histogram |
| Bollinger Bands (4H) | Expanding above upper band (breakout) |
| Derivatives Open Interest | $43.72B (+5.54%), long-heavy bias |
| Smart Money Concepts | BOS/CHoCH broken, structure flipped long |
| Trend Bias | Bullish above $2,945, breakout continuation |
Disclaimer: The information presented in this article is for informational and educational purposes only. The article does not constitute financial advice or advice of any kind. Coin Edition is not responsible for any losses incurred as a result of the utilization of content, products, or services mentioned. Readers are advised to exercise caution before taking any action related to the company.


