 Price Prediction for July 17")
The Ethereum price today has extended its bullish streak, rising above $3,100 after SharpLink’s continued ETH acquisition spree. With the Nasdaq-listed sports-tech firm now holding nearly 312,000 ETH, market participants are increasingly viewing Ethereum as a strategic treasury asset. ETH is now consolidating near the apex of a key multi-month triangle on the weekly chart, a region historically associated with high-impact moves.
Ethereum price forecast table: July 17, 2025
| Indicator/Zone | Level / Signal |
| Ethereum price today | $3,145 |
| Resistance 1 | $3,298 |
| Resistance 2 | $3,520 |
| Support 1 | $3,020 |
| Support 2 | $2,905 |
| EMA Cluster (4H) | Bullish, stacked below price |
| Bollinger Bands (4H) | Expanded, upper band holding |
| RSI (30-min) | 64.37 (bullish, no divergence) |
| MACD (30-min) | Bullish crossover, slight flattening |
| ChandeMO (1D) | 94.96 (strong momentum) |
| Volume Profile (1D) | $3,298 key resistance zone |
| Open Interest (Derivatives) | $46.31B (+7.03%) |
| Binance Top Trader Ratio | 2.23 (long-heavy bias) |
| Supertrend | Bullish across all intraday frames |
What’s happening with Ethereum’s price?
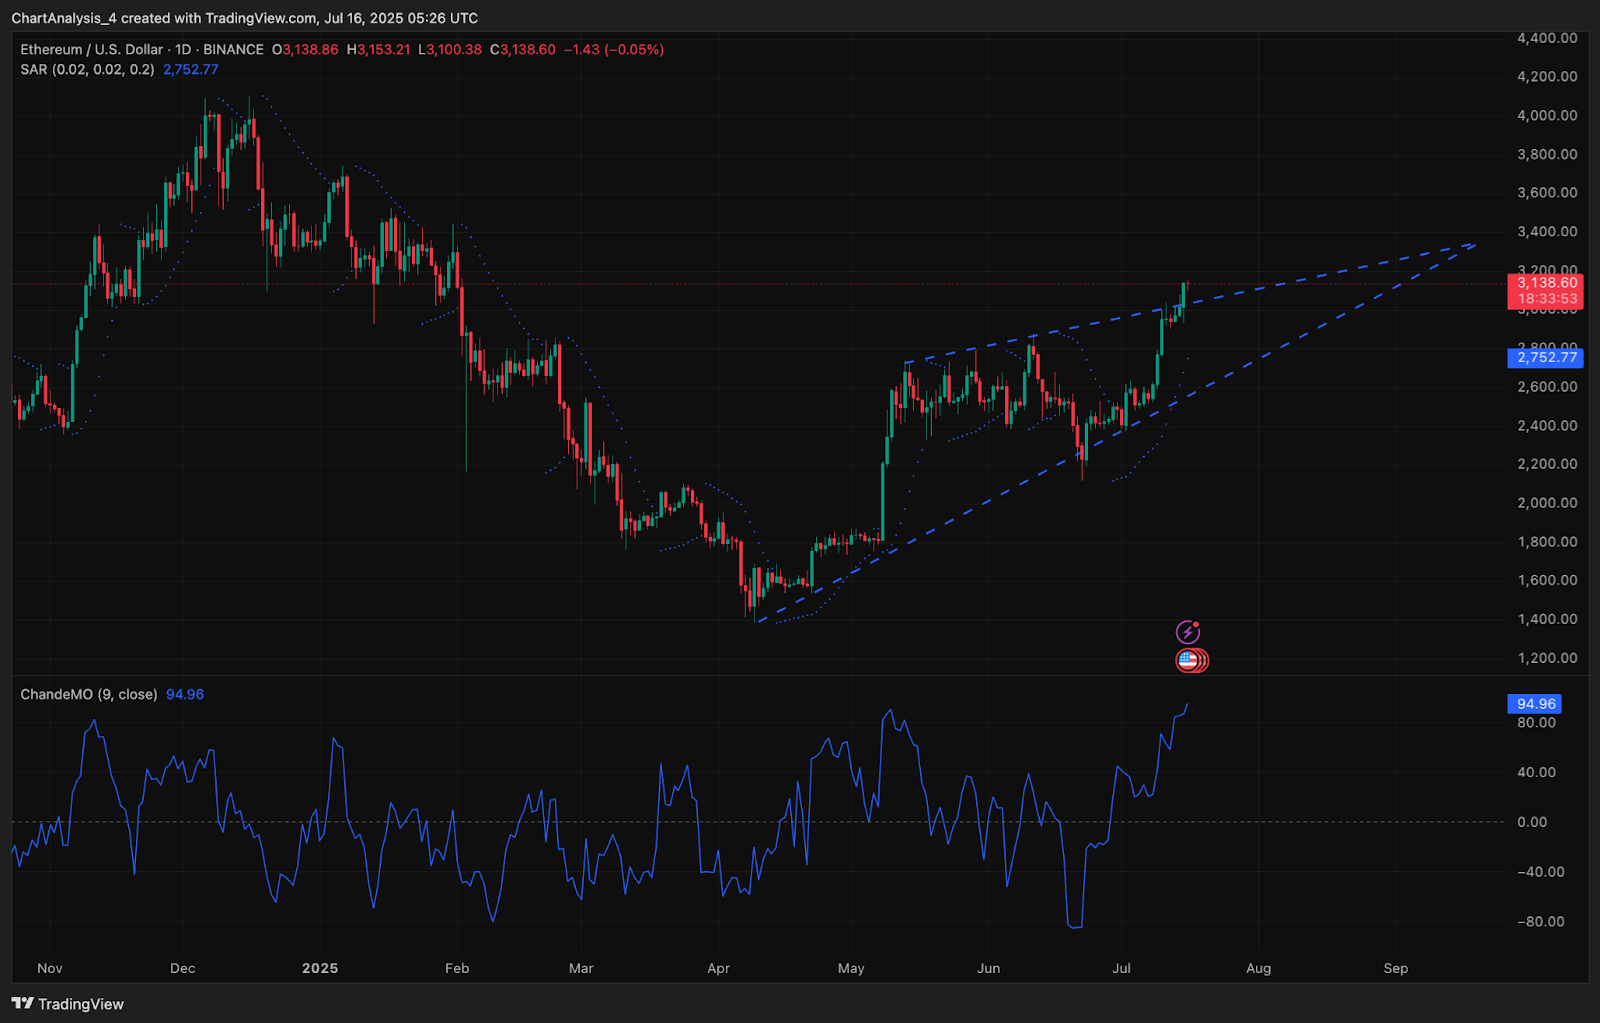
The daily structure shows Ethereum price breaking above the $2,850–$3,000 resistance band with rising momentum. Price is now trading near $3,145, just below the upper boundary of the ascending wedge visible since April. The Chande Momentum Oscillator is signaling extreme bullish strength, currently printing a value of 94.96. This marks the highest reading since late 2021, confirming sustained buyer dominance.
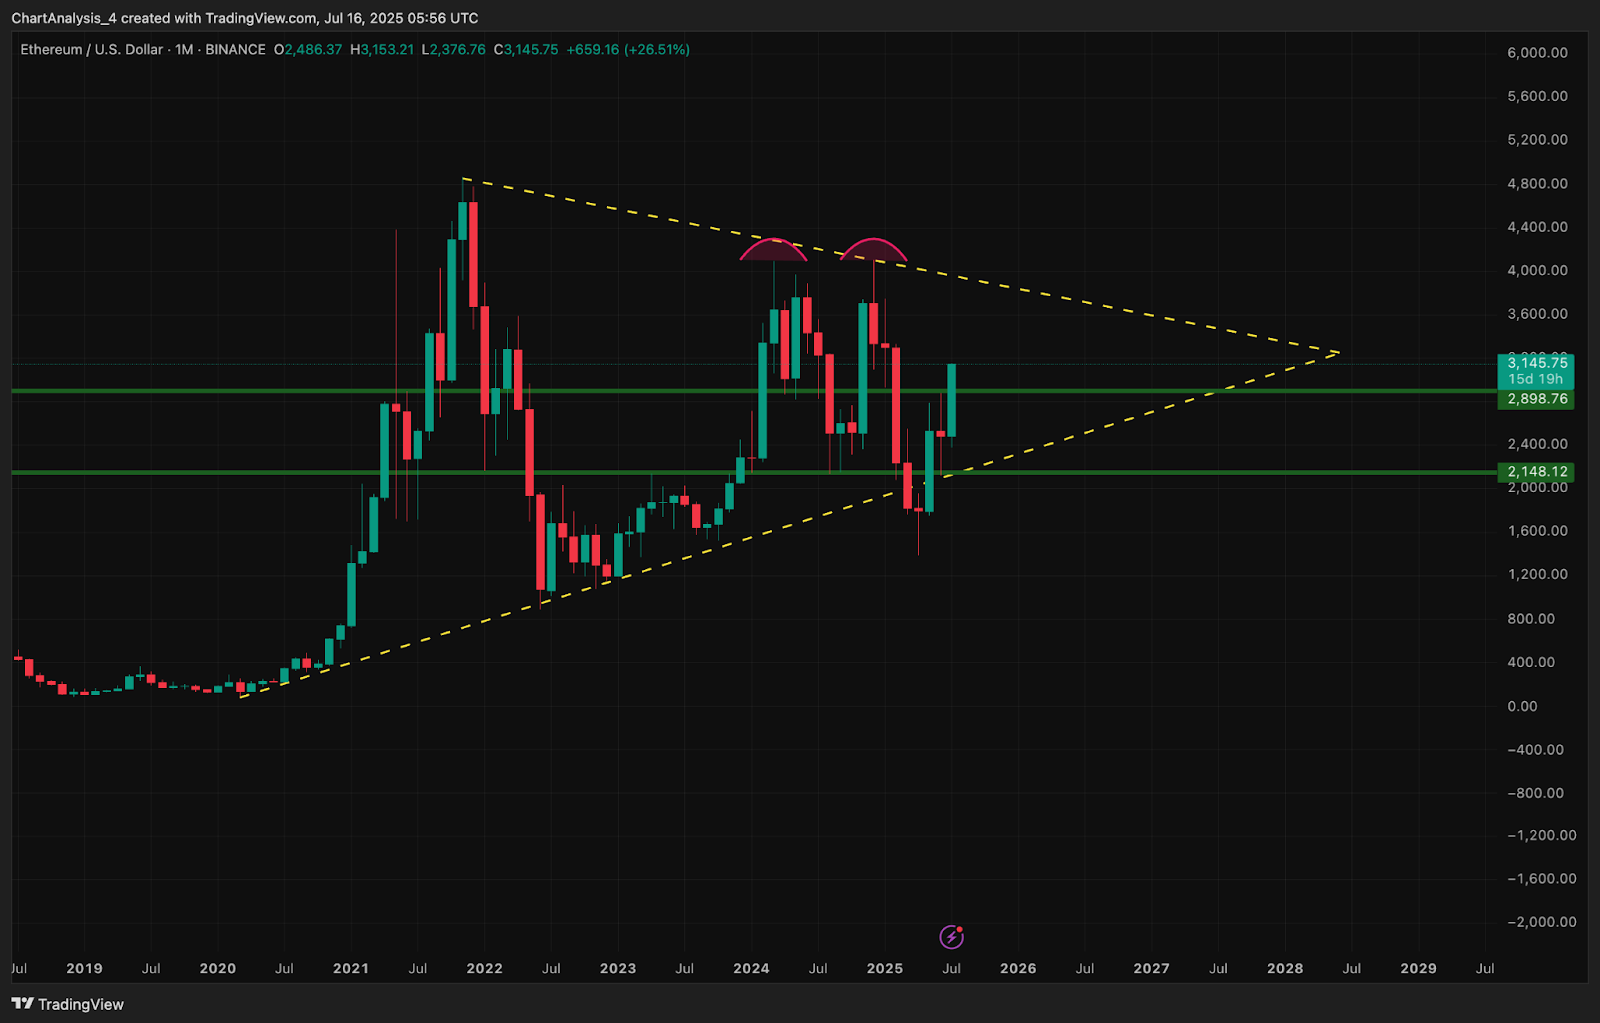
On the monthly timeframe, Ethereum is nearing the upper trendline of a multi-year triangle. The broader structure shows a large symmetrical compression dating back to 2022, with the current price pressing into the final apex. If price clears the $3,298–$3,320 resistance band, the next leg higher could target $3,520 and then $4,100, based on Fibonacci extensions and historical volume nodes.
Why is the Ethereum price going up today?
Why Ethereum price going up today is directly tied to continued corporate accumulation and strong technical alignment. SharpLink’s ETH holdings now total approximately 312,000 coins, worth over $974 million.
This includes a recent direct purchase of 10,000 ETH from the Ethereum Foundation. With most of these holdings staked or restaked, available supply has shrunk, intensifying upward pressure.
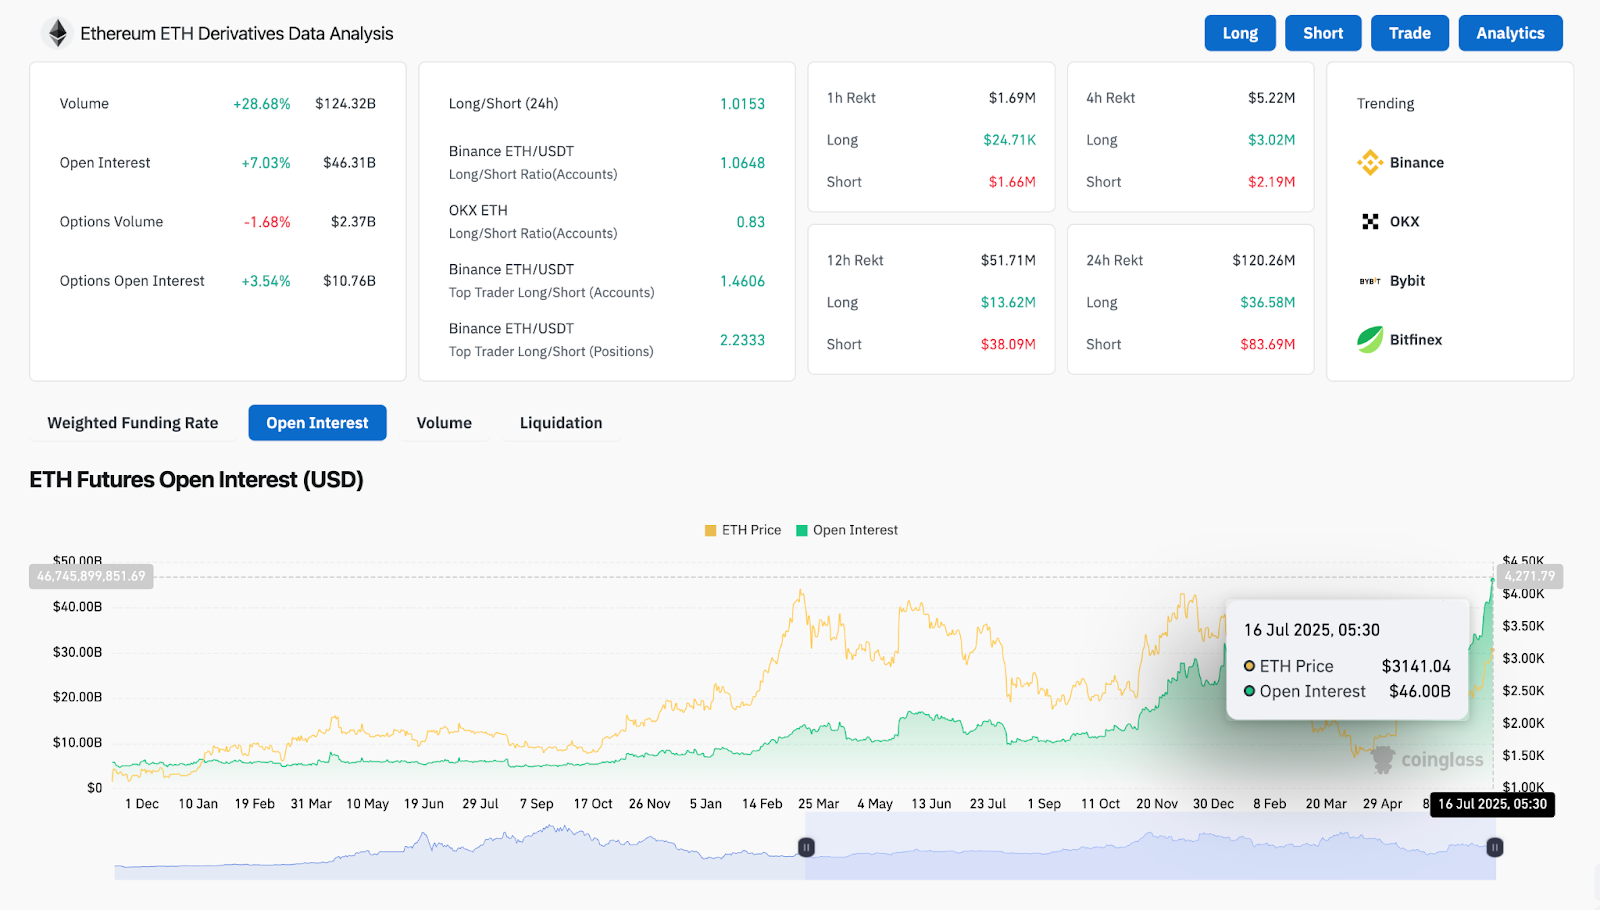
On the derivative side, ETH open interest is up 7.03% to $46.31 billion, with long/short ratios on Binance exceeding 2.23 among top trader positions. Daily volume has jumped nearly 29% to over $124 billion, reinforcing bullish sentiment. Despite overbought signals, the upward flow remains intact due to real spot accumulation and yield-based staking by institutions.
Price signals, indicators, and volume dynamics
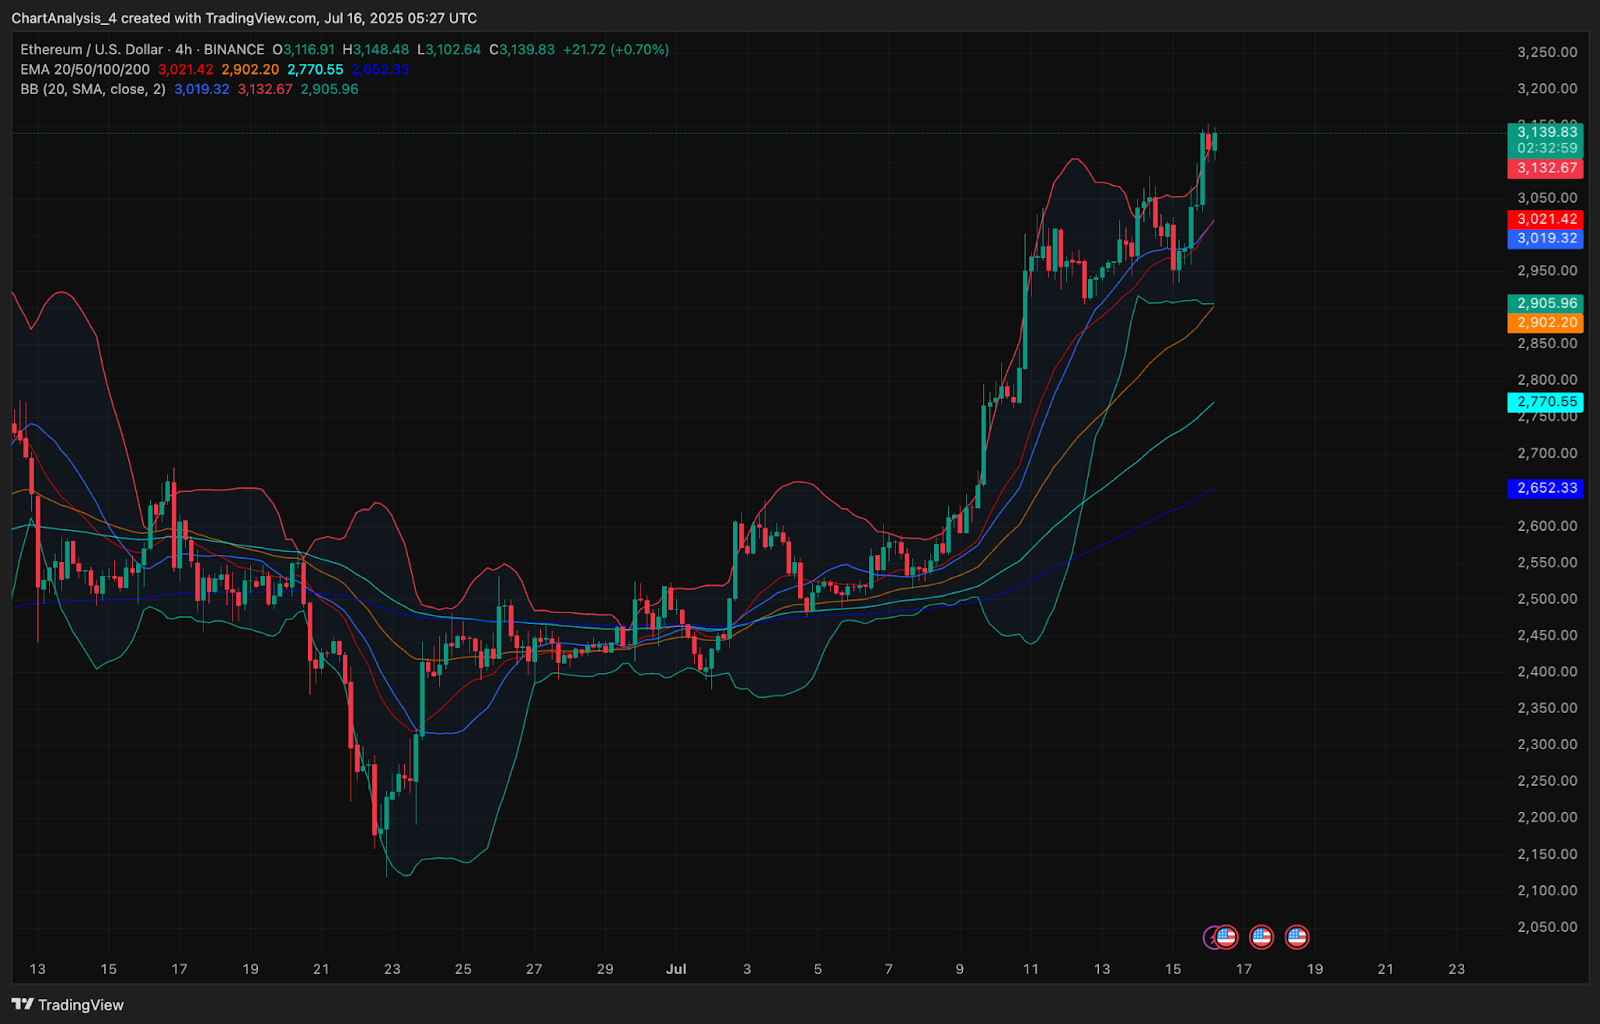
On the 4-hour chart, Ethereum price action remains comfortably above all major EMAs. The 20, 50, 100, and 200 EMA cluster between $2,770 and $2,902 now acts as strong dynamic support. Bollinger Bands are expanded and price is holding near the upper band, suggesting a fresh volatility cycle remains active.
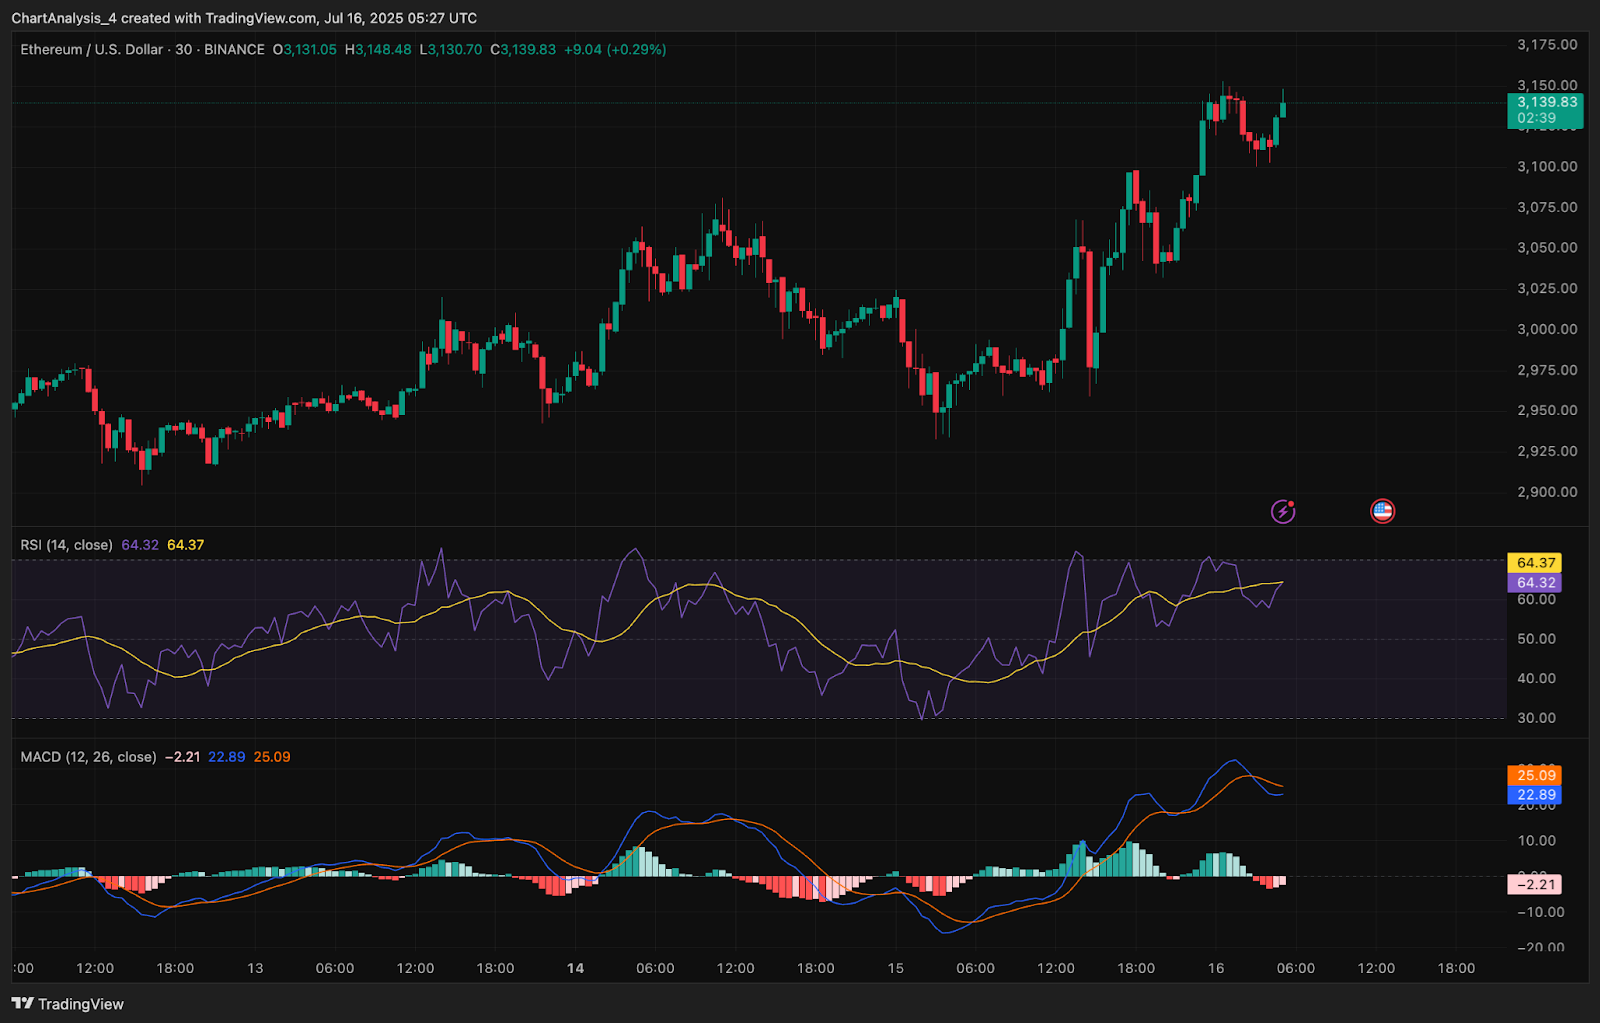
The 30-minute RSI stands at 64.37, hinting at continued bullish momentum without showing full exhaustion. MACD is still in bullish territory but shows early signs of flattening, indicating possible short-term cooling. Parabolic SAR dots remain below price across all intraday timeframes, maintaining the uptrend structure.
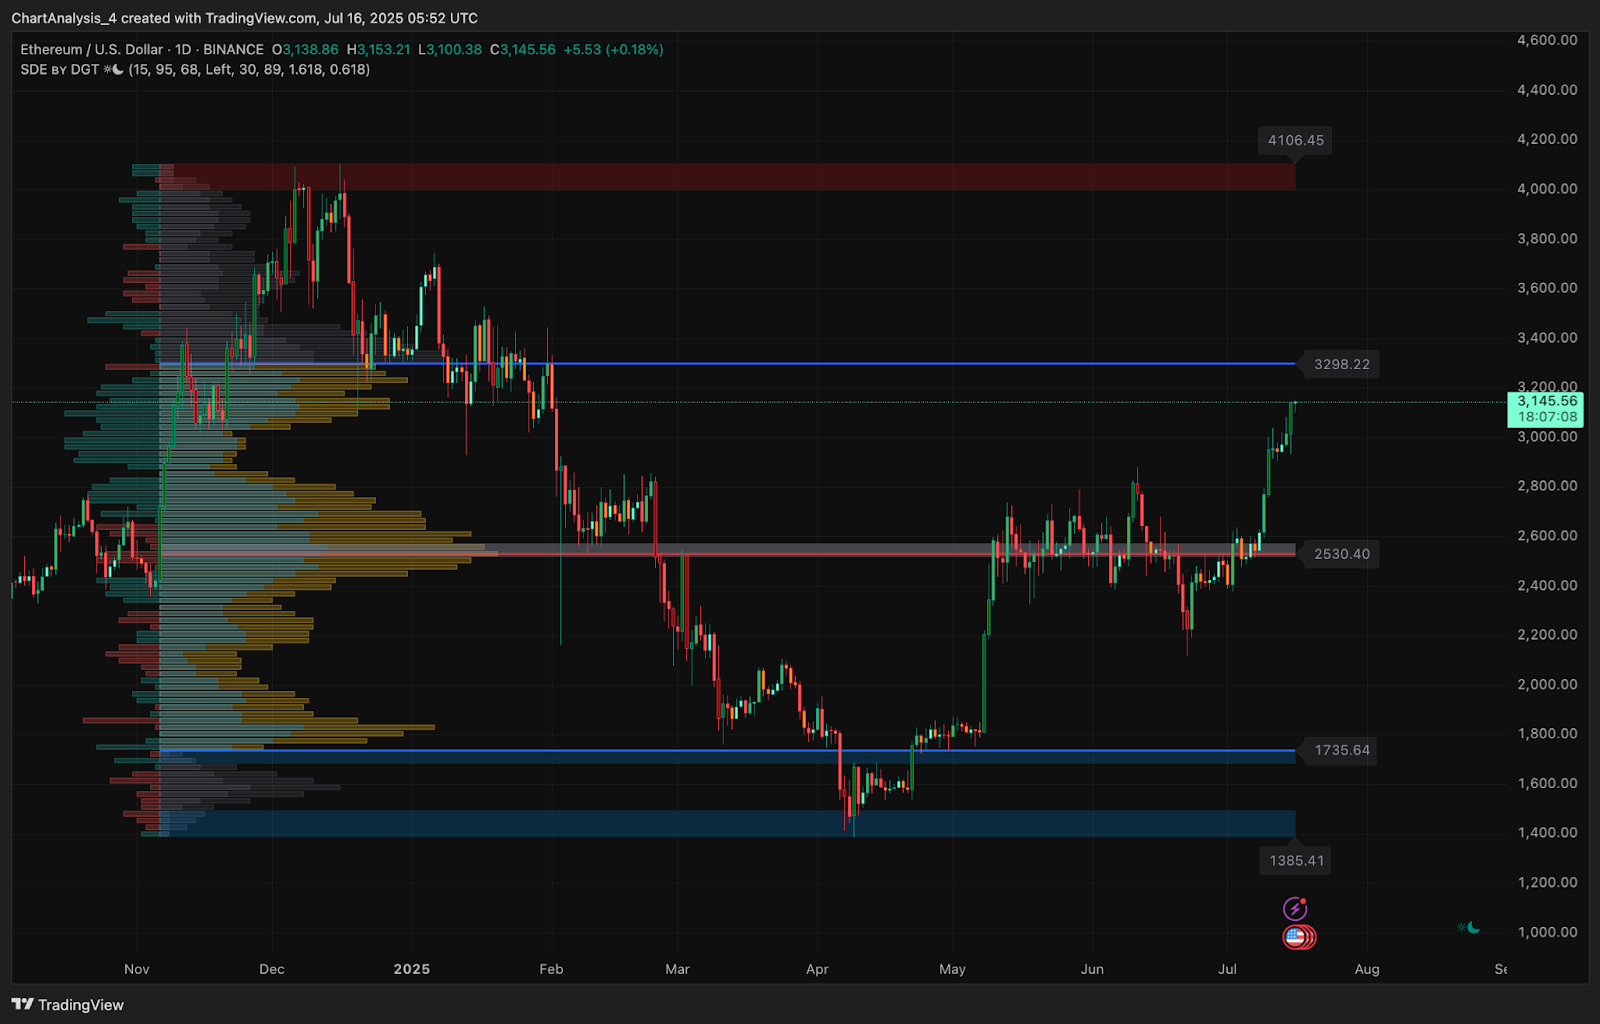
Volume Profile shows the $3,298 zone as the next major supply pocket.
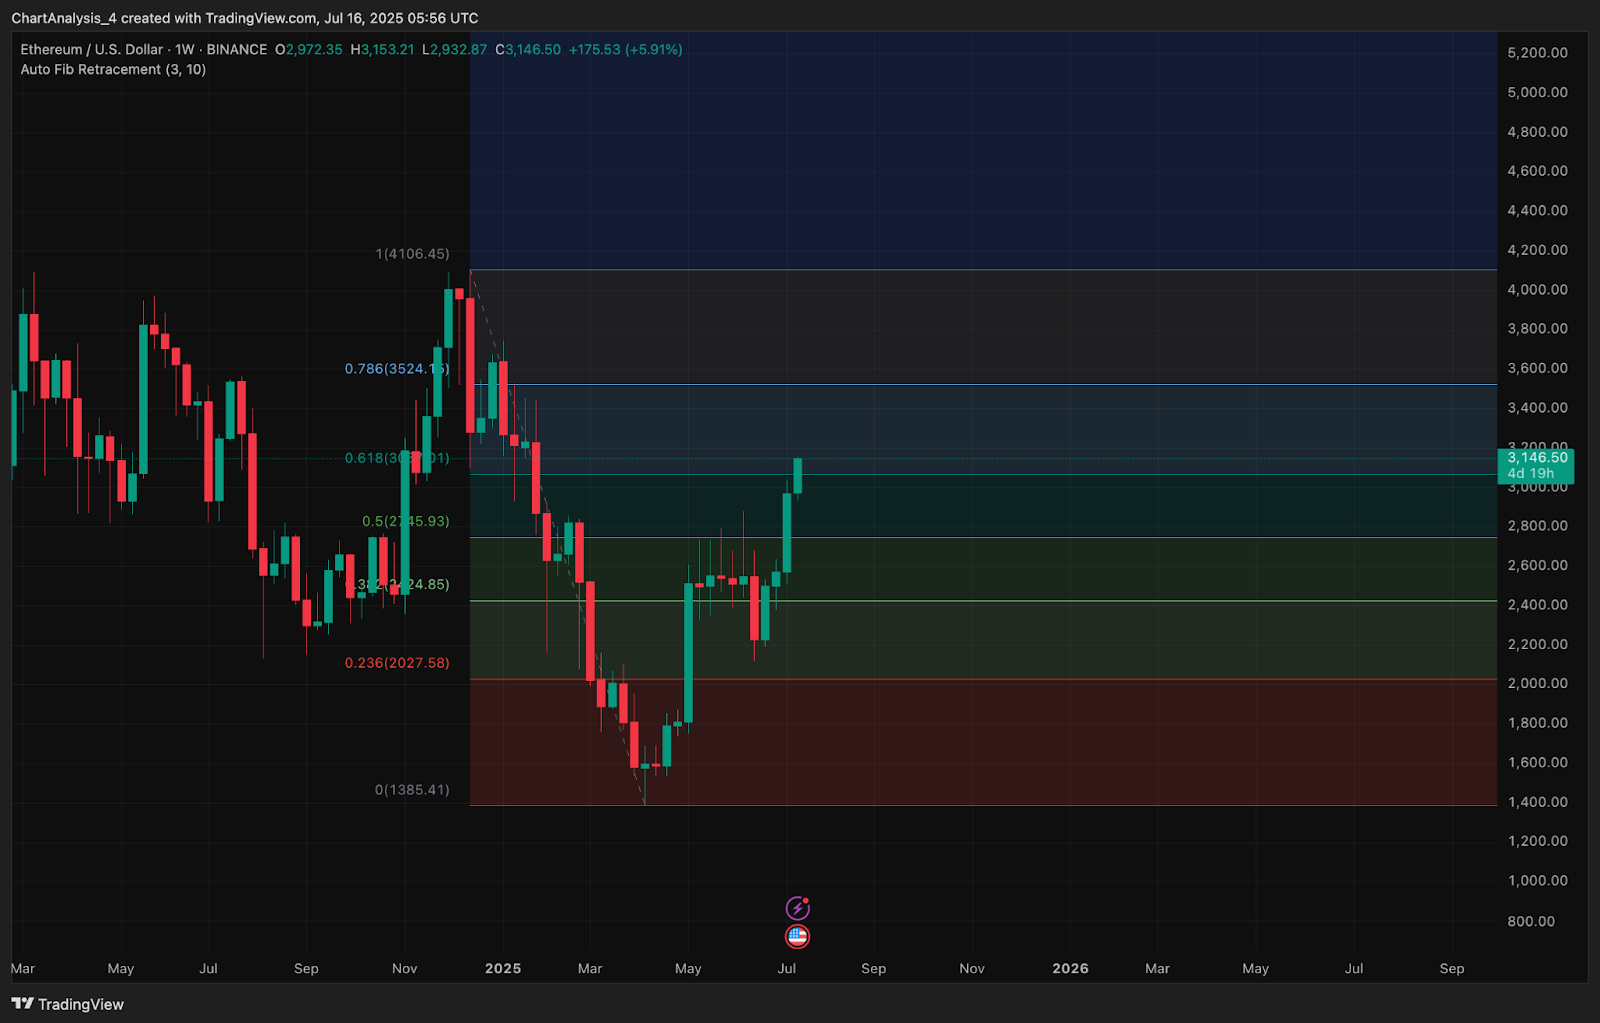
This area also aligns with weekly Fibonacci resistance (Fib 0.618 at $3,298) and prior rejection zones from November 2024. A clean break above this could unlock a run toward the Fib 0.786 level at $3,524.
Ethereum price prediction short-term outlook (24h)
For the short term, if Ethereum price today holds above $3,100, bulls are likely to attempt a breakout above the $3,298–$3,320 resistance range. If successful, this could pave the way toward $3,520 and $3,700 in extension. The triangle apex breakout also supports this trajectory, provided volume confirms the move.
On the downside, initial support lies at $3,020 (20 EMA on 4H) followed by a stronger cushion near $2,905–$2,920 where the Bollinger mean, EMA cluster, and prior breakout retest converge. A drop below this region would signal temporary exhaustion, possibly triggering a pullback toward the $2,770–$2,800 zone.
While indicators are near overbought territory, the absence of bearish divergence and steady volume inflow suggest the move could extend, especially if broader crypto market momentum persists.
Disclaimer: The information presented in this article is for informational and educational purposes only. The article does not constitute financial advice or advice of any kind. Coin Edition is not responsible for any losses incurred as a result of the utilization of content, products, or services mentioned. Readers are advised to exercise caution before taking any action related to the company.


