


: Why Bearish Bias May Linger Despite Shorts Liquidation")
- ETH correlated with BTC’s movement as shorts suffered a massive wipeout from their positions.
- ETH may not override selling pressure as the 20 EMA crossed below the 50 EMA.
- The funding rate was positive, indicating widespread bullish sentiment and risk of a potential top.
Over the last 24 hours, more than $25 million of Ethereum (ETH) positions have been liquidated. Also, Coinglass revealed that short-positioned traders accounted for the highest portion of this casualty.
This was a result of ETH’s 5% hike to $1,814 — a value it last hit two weeks back. The price rise could come as a surprise to traders, especially as the current market condition tilts toward a 50% Bitcoin (BTC) dominance.
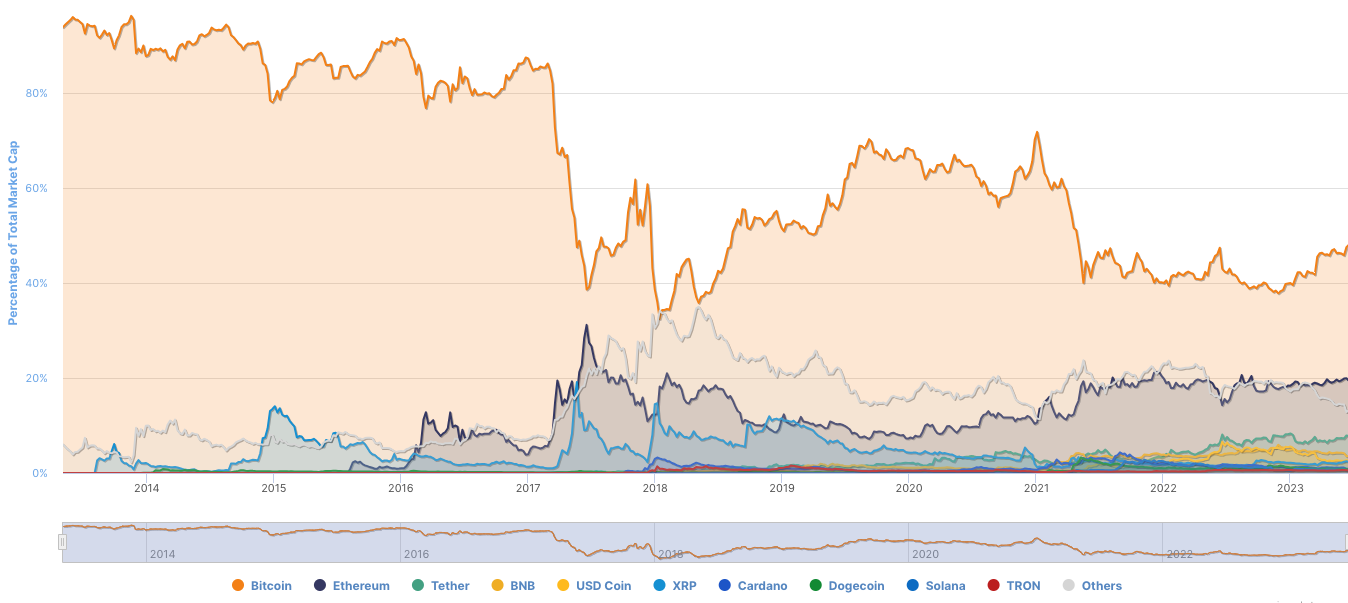
Ethereum, on the other hand, had a 19.42% dominance, according to CoinMarketCap. Typically, this infers that altcoins might find it difficult to outperform BTC. So, seeing ETH correlating with BTC’s movement might have left market participants perplexed.
Weary buyers may lead ETH down
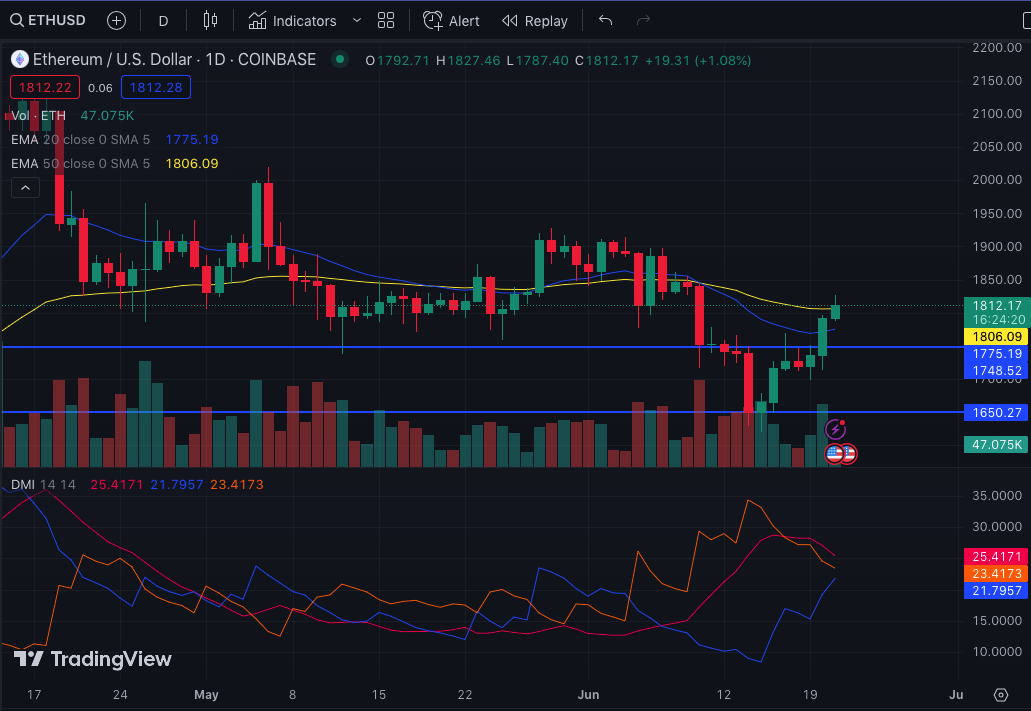
One reason ETH was able to cross the $1,800 mark was the bullish push created at $1,650 on June 15.
Although the price has been consistently upward since then, there seems to be buyer exhaustion appearing at intervals. At one point, the soaring price had to halt its movement at $1,748 due to weak demand.
Despite pushing in the upward direction, ETH’s chance of switching back to a bearish state still existed. At press time, the 20-day EMA (blue) crossed below the 50-day EMA (yellow).
Therefore, another increase in price might be unlikely in the short term. And if sell pressure appears to override buying momentum, then ETH could lose hold of the $1,800 region.
Another reason why the altcoin might not sustain the price increase is the Directional Movement Index (DMI). As of this writing, the +DMI (blue) and -DMI (orange) were 21,79 and 23.41 respectively.
Such close values indicated that the market control was still divided with neither buyer nor selling authority at full scale.
Longs control the market
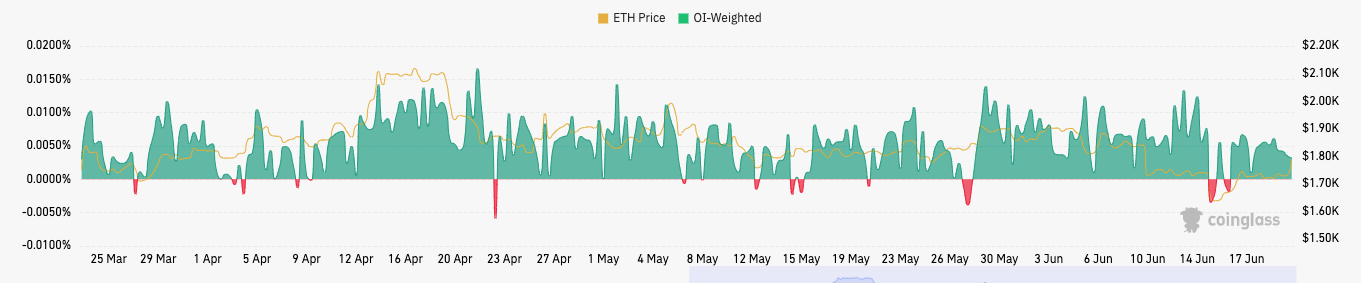
On the derivatives market end, Coinglass showed that the weighted funding rate was 0.0032%. For context, the funding rate aims to ensure that the perpetual contract price closely follows the underlying spot price.
Usually, a positive funding rate for ETH means that longs pay a funding fee to shorts while supporting a bullish bias. Conversely, if the funding rate was negative, then shorts would pay longs to maintain a bearish position.
As it stands, the funding rate also indicates a potential upcoming top. But this might only occur if traders continue to be greedy.
Thus, ETH’s chance of a rally remains in doubt. However, if the broader market decides to replicate the strides of the first quarter, then, another round of short liquidation might appear.
Disclaimer: The views, opinions, and information shared in this price prediction are published in good faith. Readers must do their research and due diligence. Any action taken by the reader is strictly at their own risk. Coin Edition and its affiliates will not be liable for direct or indirect damage or loss.
Disclaimer: The information presented in this article is for informational and educational purposes only. The article does not constitute financial advice or advice of any kind. Coin Edition is not responsible for any losses incurred as a result of the utilization of content, products, or services mentioned. Readers are advised to exercise caution before taking any action related to the company.
 Price Prediction 2026-2030: Will TRX Hit $0.50 Soon?")
 Price Prediction 2026-2050: Will HYPE Hit $100 Soon?")


: What Happens If You Use an Unlicensed Platform?")