
- Galaxy Digital’s $10.24M ETH withdrawal highlights market impact.
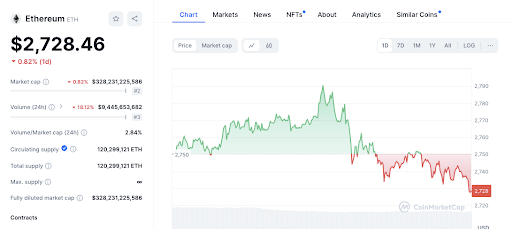
- Ethereum’s price dips to $2,736, with key support at $2,730 and resistance at $2,750.
- RSI at 44.58 suggests Ethereum is slightly oversold with MACD indicating possible decline.
Galaxy Digital recently pulled a sizable 3,735 ETH from Binance. This withdrawal, worth about $10.24 million, happened when Ethereum was trading at $2,740 per token. This move boosts Galaxy Digital’s Ethereum holdings on the blockchain to 63,984 ETH, a hefty $175 million.
As a result, Ethereum’s price saw some swings in the last 24 hours, reflecting the broader market. It climbed near $2,790 but then dropped back below $2,750. This upward movement, however, was short-lived as the price subsequently dropped, slipping below the $2,750 mark.
As at press time, Ethereum price is hovering around $2,736.12, down by 0.52% over the past day. The market now exhibits signs of stabilization, though the downward pressure has not entirely dissipated.
Key support and resistance levels are important to understand where the price might go next. Ethereum currently has support at $2,730, a level it’s tested multiple times without breaking. If the price keeps dropping, the next major support is at $2,700, which could provide stronger resistance.
On the upside, Ethereum faces immediate resistance at $2,750. A break above this level could indicate a potential resumption of the earlier bullish trend. Furthermore, the recent high near $2,790 stands as a critical resistance point. Surpassing this level could lead to a continuation of the bullish trend, potentially driving the price higher.
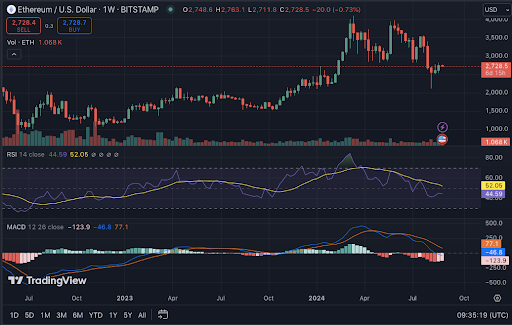
Looking at technical indicators, the 1-week Relative Strength Index (RSI) for Ethereum is currently at 44.58. This suggests Ethereum might be a bit oversold in the short term, but it’s not extremely oversold yet. Also, the 1-week Moving Average Convergence Divergence (MACD) indicator is trading below the signal line. This pattern hints at possible downward momentum for Ethereum in the near future.
Disclaimer: The information presented in this article is for informational and educational purposes only. The article does not constitute financial advice or advice of any kind. Coin Edition is not responsible for any losses incurred as a result of the utilization of content, products, or services mentioned. Readers are advised to exercise caution before taking any action related to the company.


