
- Ethereum trades around $4,334, holding the $4,300 support after slipping below its 20-day EMA.
- ETF data shows $8.7M outflow, offset by BlackRock’s $39.3M accumulation in Ethereum funds.
- On-chain flows show $21M outflow, testing buyer conviction at $4,180–$4,050 support zone.
Ethereum (CRYPTO: ETH) price today is trading near $4,334, slipping below the 20-day EMA at $4,388 as short-term sentiment turned cautious after ETF data showed renewed outflows. Despite a strong institutional buy from BlackRock, traders remain defensive as technical indicators approach a key decision zone around $4,300.
Ethereum Price Holds Fib Support Amid Weak Momentum
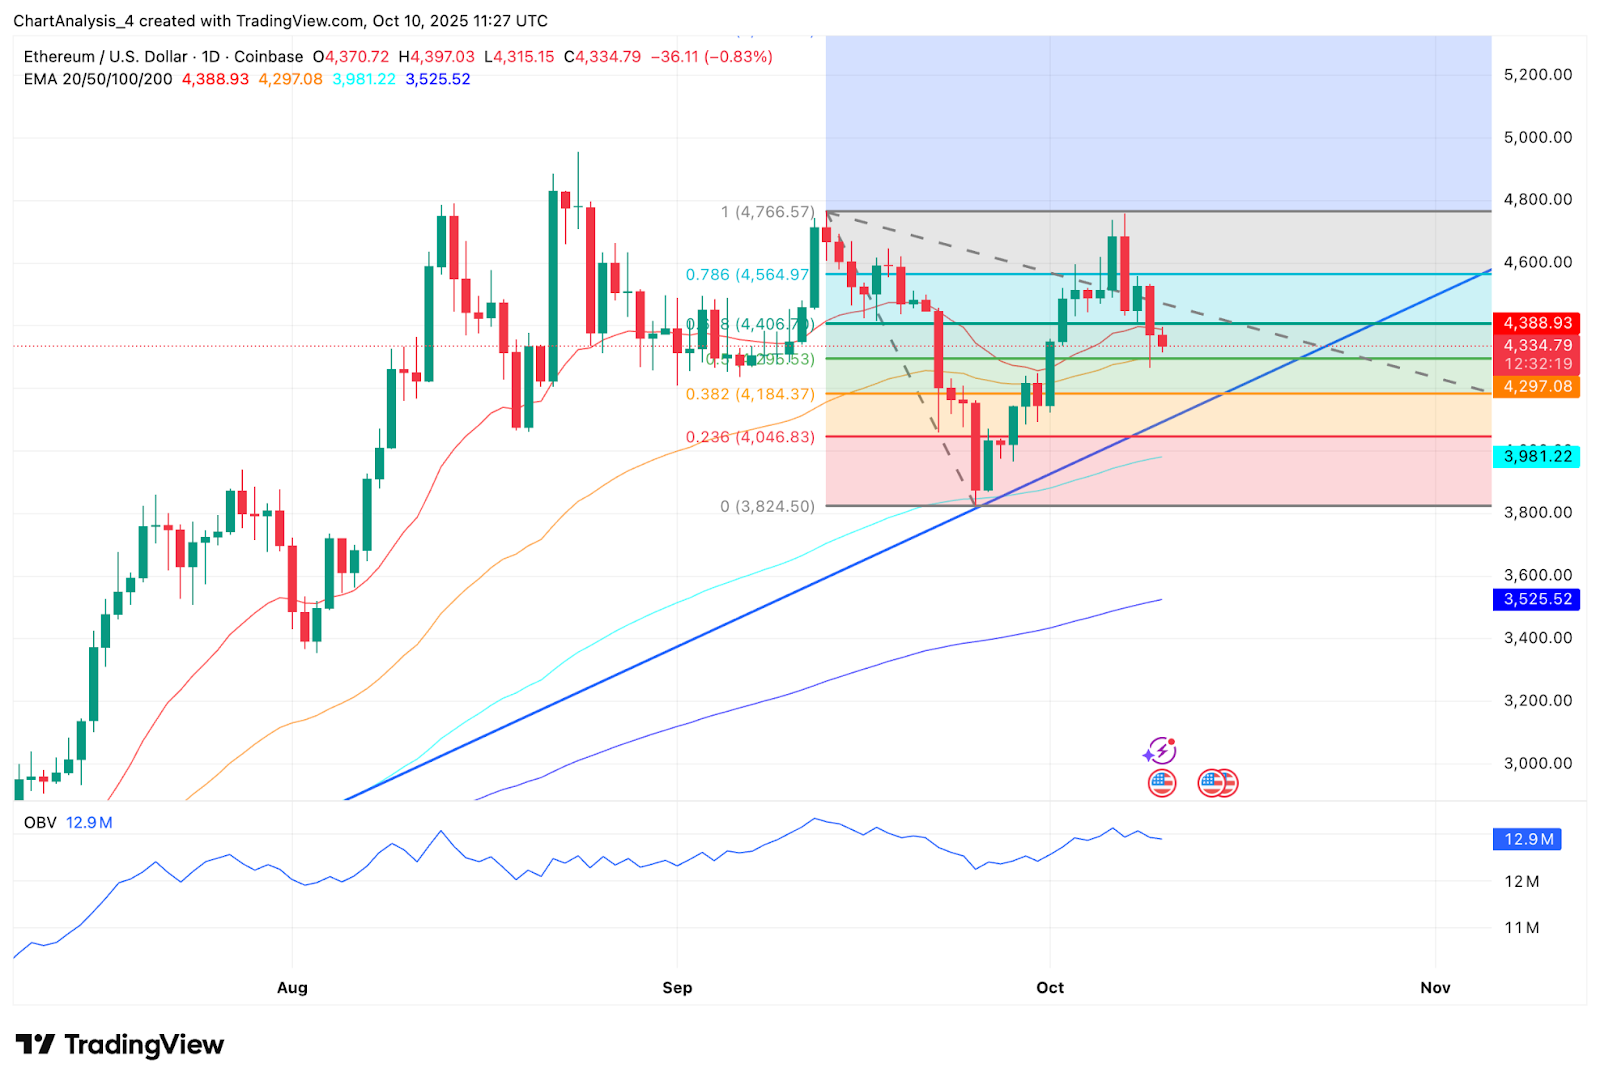
The daily chart shows Ethereum consolidating between $4,300 and $4,460, with the 0.618 Fibonacci retracement at $4,356 providing near-term resistance. The ascending trendline from late September remains intact, with support now seen at $4,184 — the 0.382 Fib level.
Below this, deeper support lies near $4,046, which aligns with the 0.236 retracement and the August breakout base. A rebound from this zone could reignite the uptrend, while a breakdown would risk a slide toward $3,980, where the 100-day EMA currently rests.
Related: Dogecoin Price Prediction: Traders Eye $0.30 Target as DOGE Consolidates Again
Momentum indicators have softened, with the RSI hovering near 46, showing neutral-to-bearish sentiment. The overall trend remains constructive as long as ETH stays above the $4,180 line, though fading strength suggests consolidation could continue before the next leg higher.
ETF Flows Turn Mixed As BlackRock Accumulates
ETF flow data released on October 10 revealed a net outflow of $8.7 million from Ethereum funds, highlighting renewed selling pressure after weeks of steady inflows. However, BlackRock reportedly purchased $39.3 million worth of Ethereum, signaling selective institutional accumulation even as other issuers like Fidelity and Bitwise posted small redemptions.
Analysts say this divergence suggests capital rotation among ETF participants rather than a broad exit. If BlackRock’s buying continues while overall outflows shrink, it could provide the stability ETH needs to hold the $4,300 floor and prepare for a recovery toward $4,500.
On-Chain Flows Show $21 Million Net Outflow
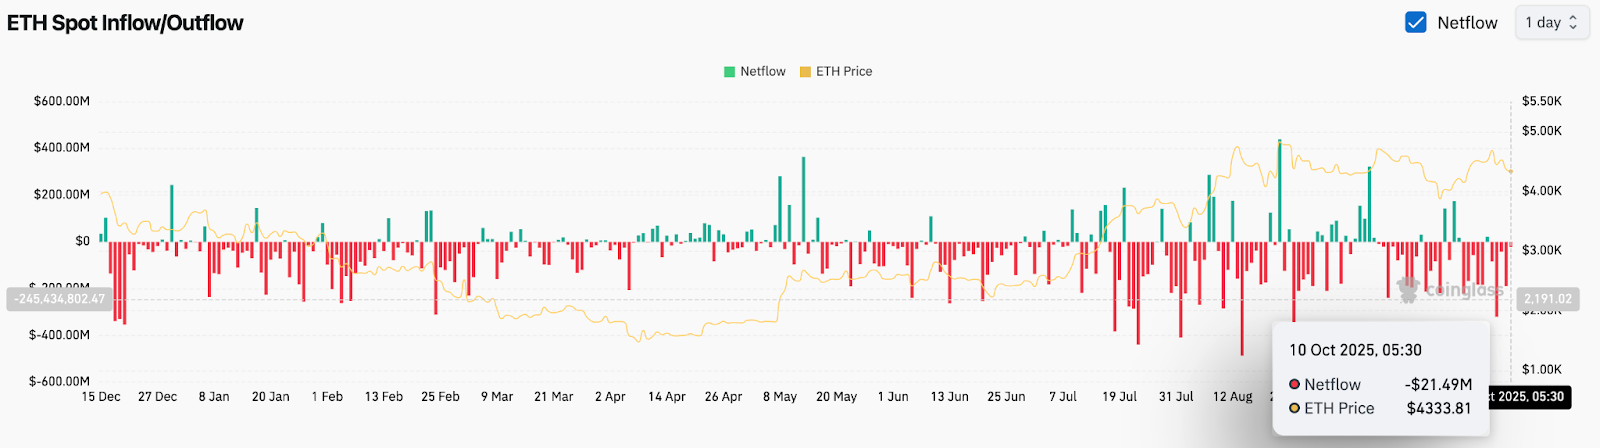
Coinglass data shows that Ethereum recorded a $21.49 million net outflow on October 10, following a week of light but consistent selling activity. This reinforces the cautious tone reflected in ETF movements, suggesting traders are trimming positions rather than building exposure.
Despite the outflows, Ethereum’s price action has been resilient compared to August levels, with no evidence of large-scale panic selling. Analysts note that sustained daily outflows below $50 million remain manageable for now, but any acceleration could put pressure on the $4,180–$4,050 support area.
Related: Litecoin Price Prediction: Traders Bullish on LTC as ETF Optimism Fuels Momentum
The on-balance volume indicator (OBV) remains steady around 12.9 million, signaling that accumulation from medium-term holders is offsetting short-term trader exits.
Technical Setup Points To Crucial Crossroads
From a structural standpoint, Ethereum is testing a major confluence zone that combines the ascending trendline, 38.2% Fibonacci retracement, and the 50-day EMA near $4,184–$4,297. This range will decide whether ETH resumes its broader uptrend or slips into a corrective phase.
A bullish reversal above $4,420 could trigger a push toward $4,565, the 0.786 retracement level, and later $4,766, the September high. Conversely, failure to defend $4,184 would open the door to $4,046 and possibly $3,981, with the next critical defense lying at the 200-day EMA near $3,525.
Outlook: Will Ethereum Go Up?
The near-term Ethereum price prediction depends heavily on whether buyers can reclaim control above the 20-day EMA and reverse the ETF-driven caution. The $4,300 zone remains pivotal, acting as both structural and psychological support.
If inflows resume and price holds above $4,184, analysts expect ETH to attempt a rebound toward $4,560 in the coming sessions. However, if ETF redemptions persist and on-chain outflows increase, Ethereum could face a short-term dip toward the $4,050–$3,980 range before stabilizing.
Overall, the medium-term outlook remains positive as long as ETH stays above $3,980, but conviction will depend on whether institutional accumulation continues to outweigh profit-taking pressure.
Technical Outlook For Ethereum Price
| Direction | Key Levels | Indicators |
| Upside targets | $4,420, $4,565, $4,766 | Fibonacci & EMA alignment |
| Downside supports | $4,184, $4,046, $3,981 | Trendline & 100-day EMA |
| Trend bias | Neutral to bullish | RSI 46, consolidation phase |
| Catalyst watch | ETF flows, on-chain accumulation | Institutional buying trend |
Related: Cardano Price Prediction: Hydra Node 1.0 Launch Sparks Fresh Optimism
Disclaimer: The information presented in this article is for informational and educational purposes only. The article does not constitute financial advice or advice of any kind. Coin Edition is not responsible for any losses incurred as a result of the utilization of content, products, or services mentioned. Readers are advised to exercise caution before taking any action related to the company.


