
After bouncing from a weak low at $2,200 earlier this week, the Ethereum price today is trading near $2,485, recovering sharply from recent losses. The recovery has been technically clean, with ETH reclaiming key EMAs and invalidating a recent bearish break of structure (BOS). However, price is now approaching the lower bound of a stubborn supply zone between $2,500 and $2,600 — an area that previously triggered multiple sell-offs.
What’s Happening With Ethereum’s Price?
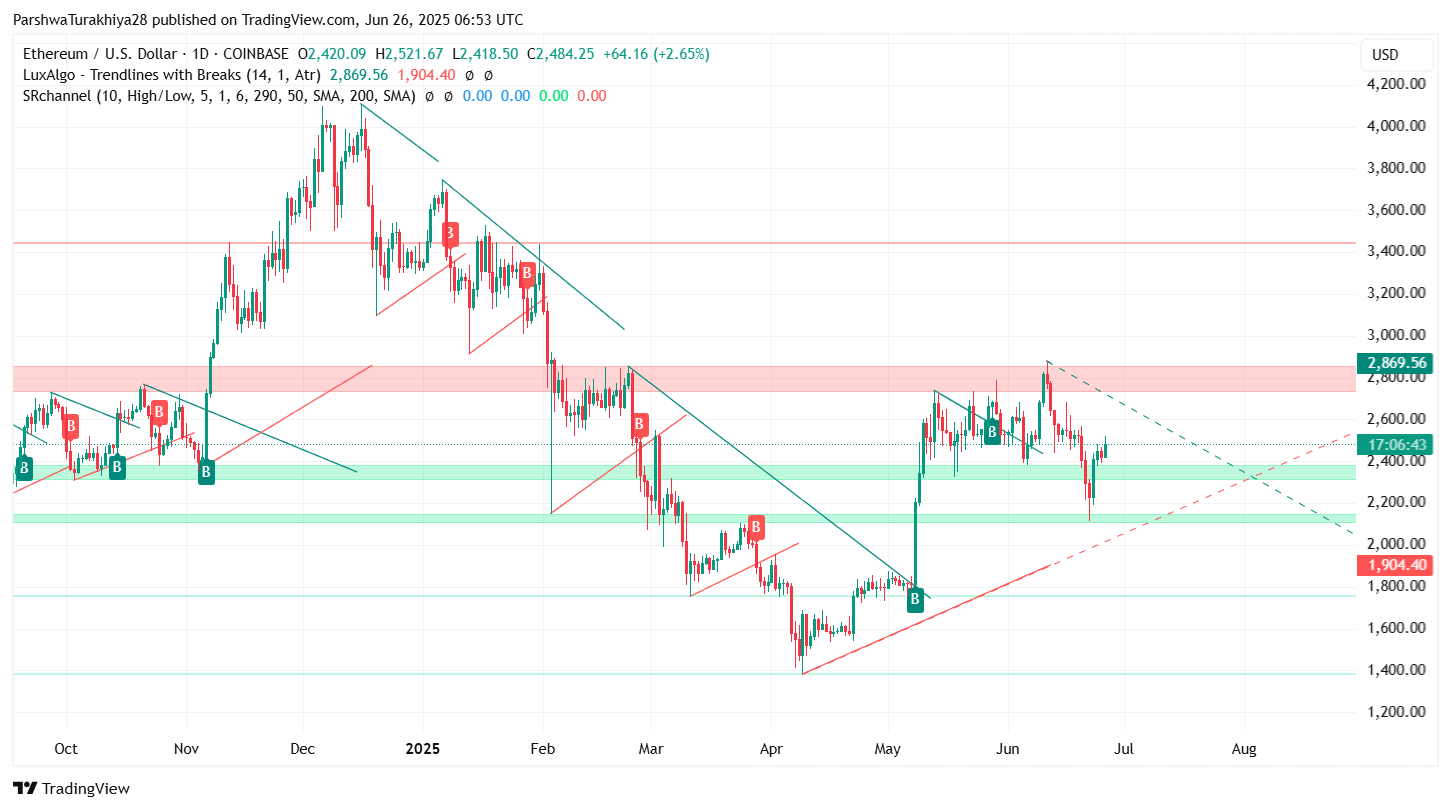
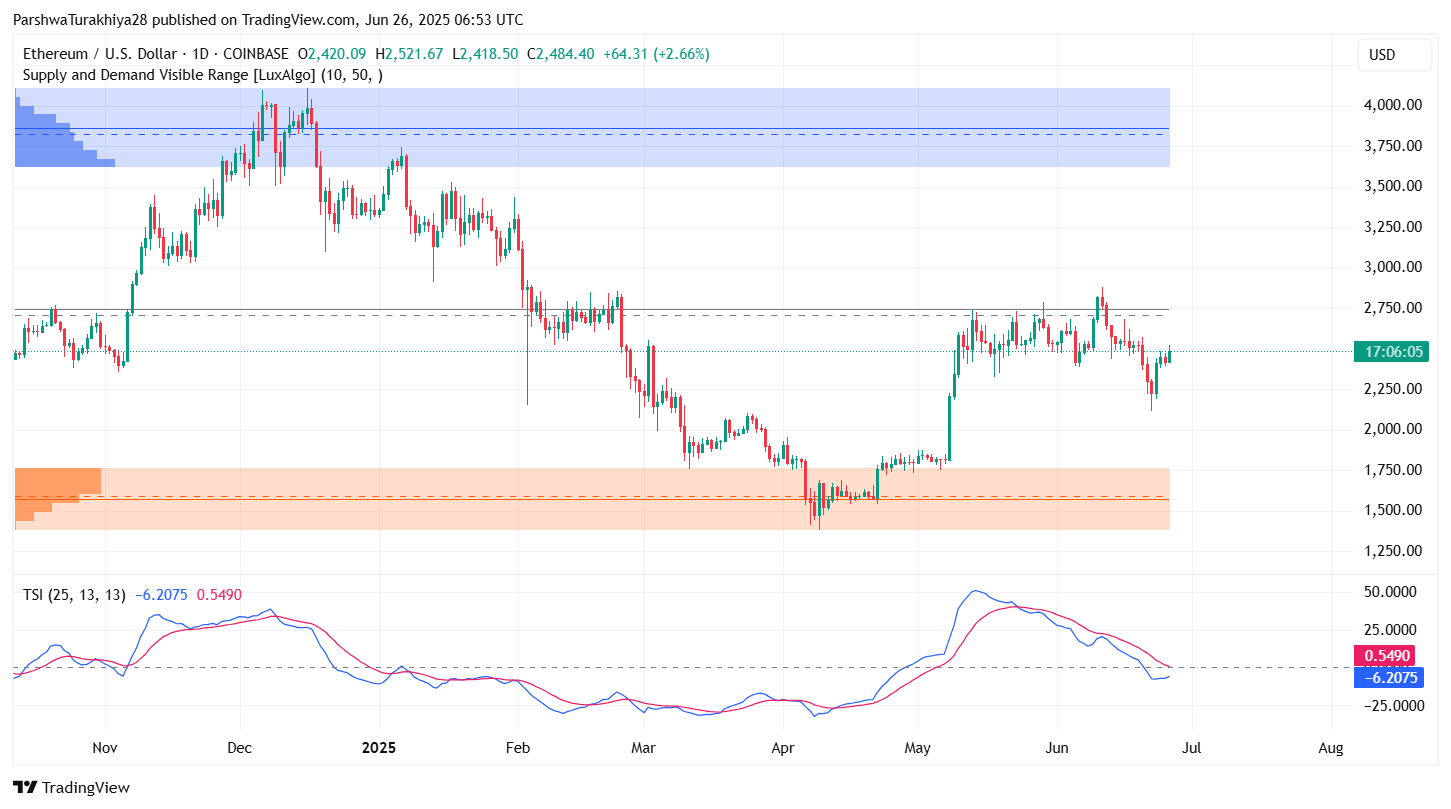
Recent Ethereum price action has been marked by a sharp recovery from the $2,200–$2,240 liquidity block. The daily chart shows ETH forming a bullish engulfing candle on June 25, followed by continuation above the 50 EMA. The move has flipped the short-term trend back in favor of buyers, especially with the daily close reclaiming the $2,470 demand area.

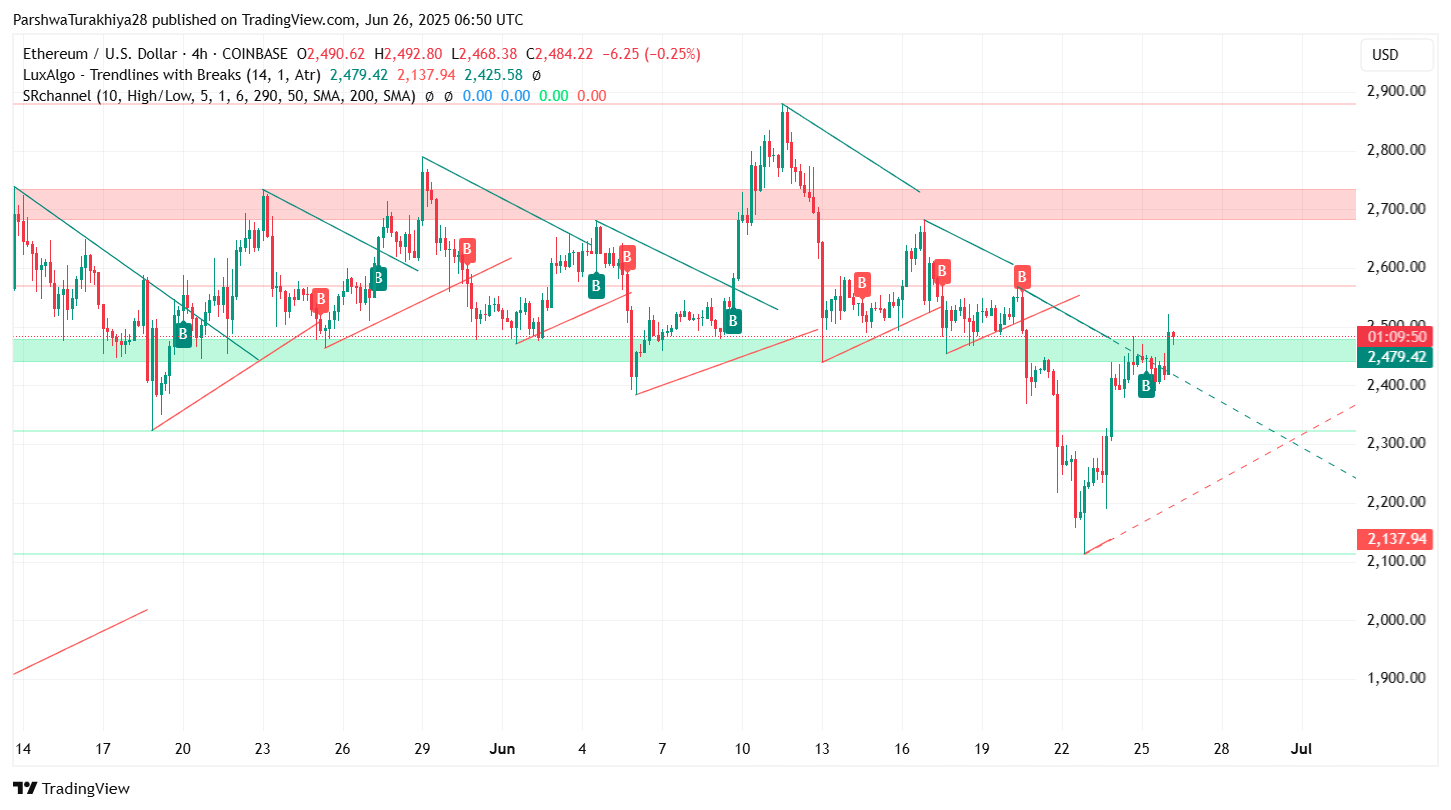
The 4-hour chart indicates a fresh break of structure (BOS) above $2,480 after several failed attempts, while the Smart Money Concepts tool shows a clear bullish CHoCH around the same region. ETH is currently pressing into a local supply zone between $2,500 and $2,560. If this level is broken with volume, the next leg could test the weekly Fib 0.5 zone near $2,746.
In terms of historical significance, the $2,420–$2,480 cluster also marked the breakout region in May, adding further importance to this retest. Price is now back above the ascending trendline that was lost last week.
Why is the Ethereum Price Going Up Today?
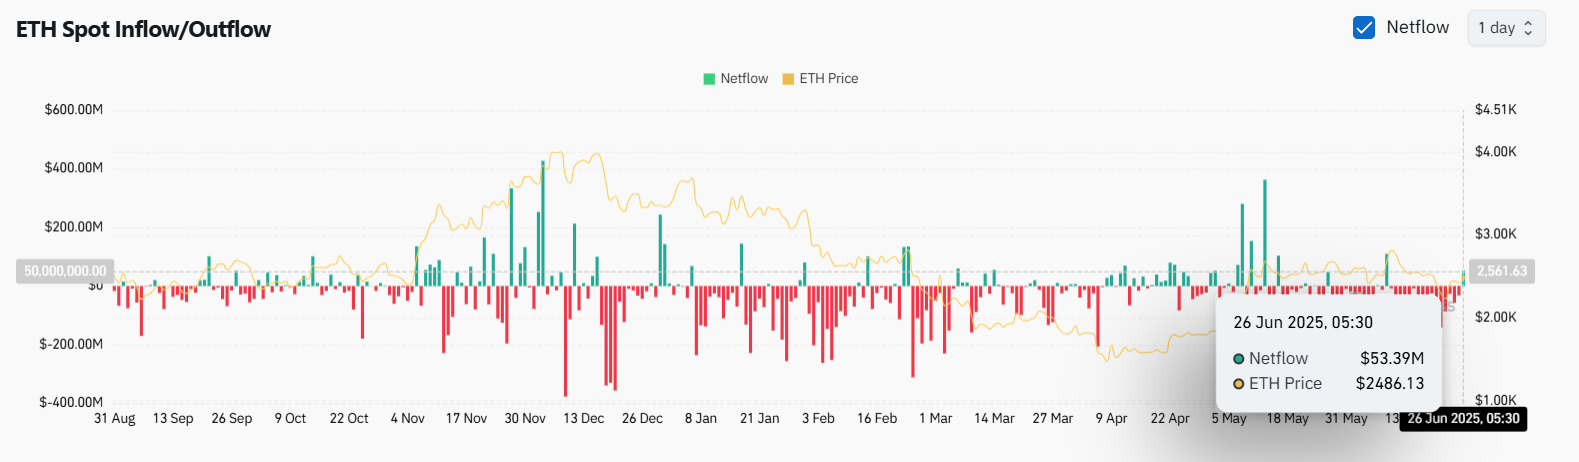
The key reason why Ethereum price going up today is the strong spot demand return, as shown in the ETH netflow chart. On June 26, a net inflow of over $53M was recorded, marking one of the largest single-day inflows in weeks. This aligns with reclaim patterns on the daily and 4-hour structure charts.
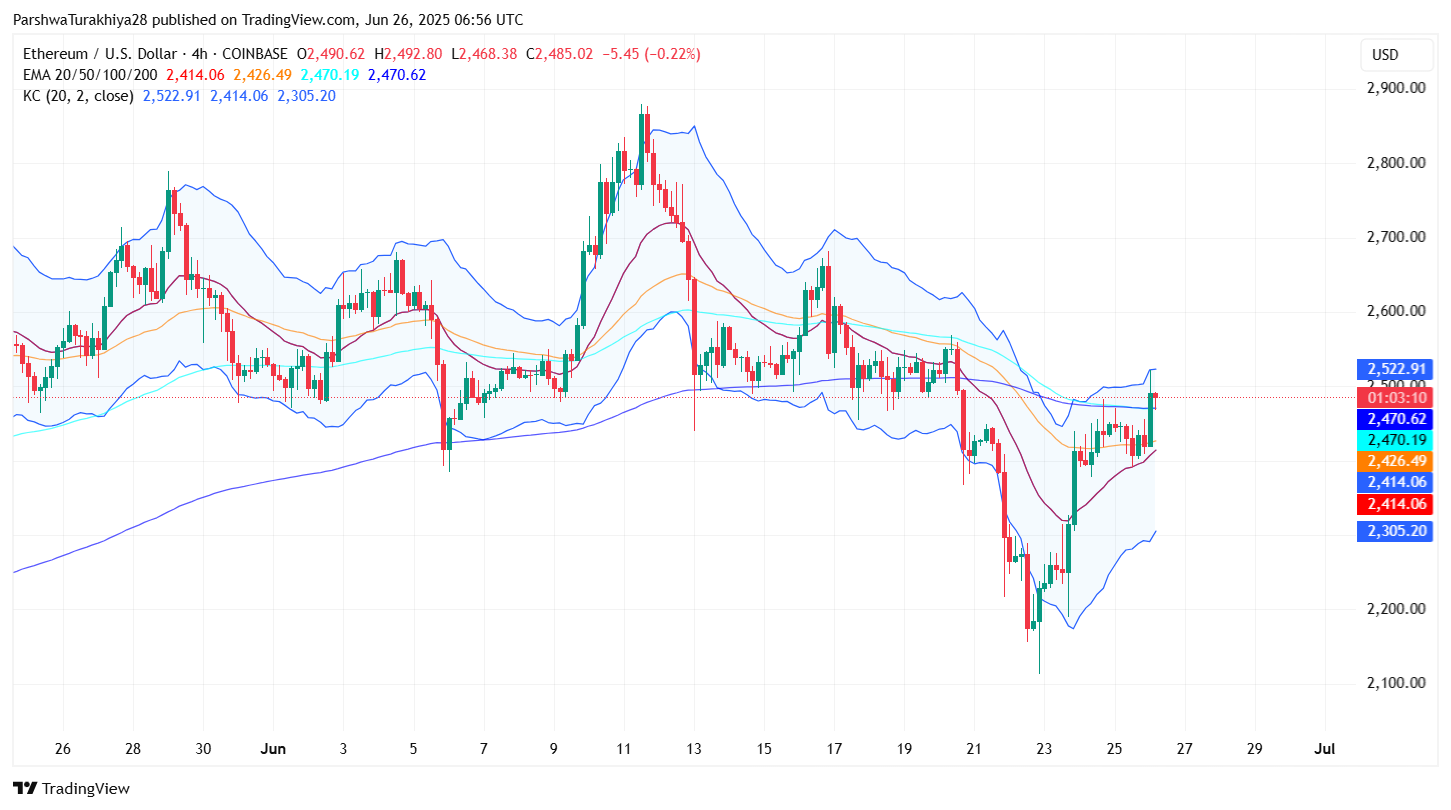
Moreover, Ethereum has reclaimed the 20/50/100 EMA cluster on the 4H chart, with current price at $2,485 above all short-term moving averages. From an indicator standpoint, the Keltner Channel bands on the 4H are expanding upward with ETH riding the upper channel, confirming strong directional momentum. The 4H Bollinger Bands are also widening, suggesting building Ethereum price volatility into the $2,500 zone.
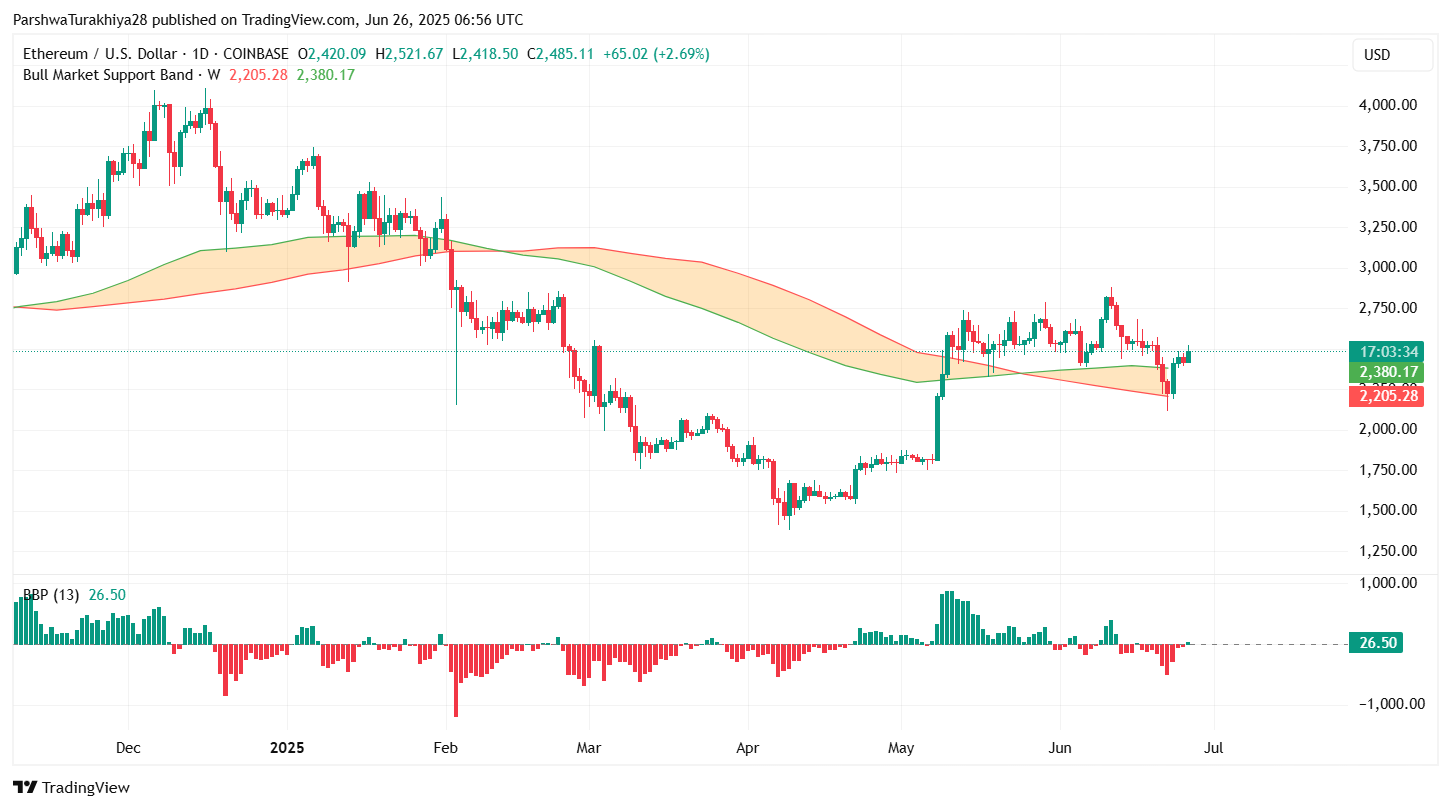
The Bull Market Support Band on the 1D chart — previously acting as resistance around $2,380 — has now flipped into support, with ETH closing above it for the first time in over a week.
Ethereum Price Indicators Show Critical Retest at $2,500–$2,560 Zone
On the 4-hour chart, price has entered the first test of the red supply block between $2,500 and $2,560. This region has rejected three prior upside attempts in June, and this retest could determine whether ETH resumes its macro bullish trend or retraces.
True Strength Index (TSI) on the 1D chart is starting to curve upward from deeply negative territory, with a pending bullish crossover. This further strengthens the argument for continuation if the breakout succeeds.

Meanwhile, Ethereum’s weekly Fib retracement chart places the 0.382 level at $2,637 and the 0.5 mark near $2,746 — both of which will become realistic upside targets if the $2,560 barrier is broken with volume.
However, traders must note the presence of equal highs and low-timeframe bearish CHoCH zones near $2,560. Without strong bullish confirmation, this area may again act as a reversal trigger.
Ethereum Price Prediction: Short-Term Outlook (24h)
As long as ETH stays above the $2,420 support band, bulls are in control. A 4H candle close above $2,500 would signal short-term breakout strength, with the next upside level seen at $2,560. If that gets cleared, $2,637 and $2,746 will be on the radar.
On the downside, a rejection below $2,470 reopens the door toward $2,425, followed by $2,300. The 200 EMA on the 4H sits at $2,305 and may act as a strong dynamic support if price fails to maintain bullish structure.
Spot outflows have started to slow, which means bulls need sustained momentum or the breakout attempt may fizzle. Given the rising volatility and reclaim of key zones, short-term bias remains Ethereum price bullish, but cautious.
Ethereum Price Forecast Table: June 27, 2025
| Indicator / Zone | Level (USD) | Signal |
| Ethereum price today | $2,485 | Reclaiming structure |
| Resistance 1 | $2,500 | Supply zone lower bound |
| Resistance 2 | $2,560 | Key rejection zone |
| Support 1 | $2,470 | Retest region |
| Support 2 | $2,425 | Weekly demand zone |
| EMA Cluster (4H) | $2,414–$2,470 | Bullish alignment |
| Bull Market Support Band | $2,380 | Reclaimed support |
| Fib 0.382 / 0.5 Levels | $2,637 / $2,746 | Upside breakout targets |
| Keltner Bands (4H) | Expanding | Volatility increase |
| TSI (Daily) | -6.20 (rising) | Early bullish reversal signal |
| ETH Netflow | +$53.39M | Bullish accumulation |
Disclaimer: The information presented in this article is for informational and educational purposes only. The article does not constitute financial advice or advice of any kind. Coin Edition is not responsible for any losses incurred as a result of the utilization of content, products, or services mentioned. Readers are advised to exercise caution before taking any action related to the company.


