
The Ethereum price today is holding above $3,430 after a steep rally that followed a breakout from a multi-month cup and handle pattern. Price surged past $3,100 earlier this week and is now approaching a key zone near $3,500. Traders are watching closely to see if this upside continuation holds or if a temporary pause sets in at resistance.
What’s Happening With Ethereum’s Price?
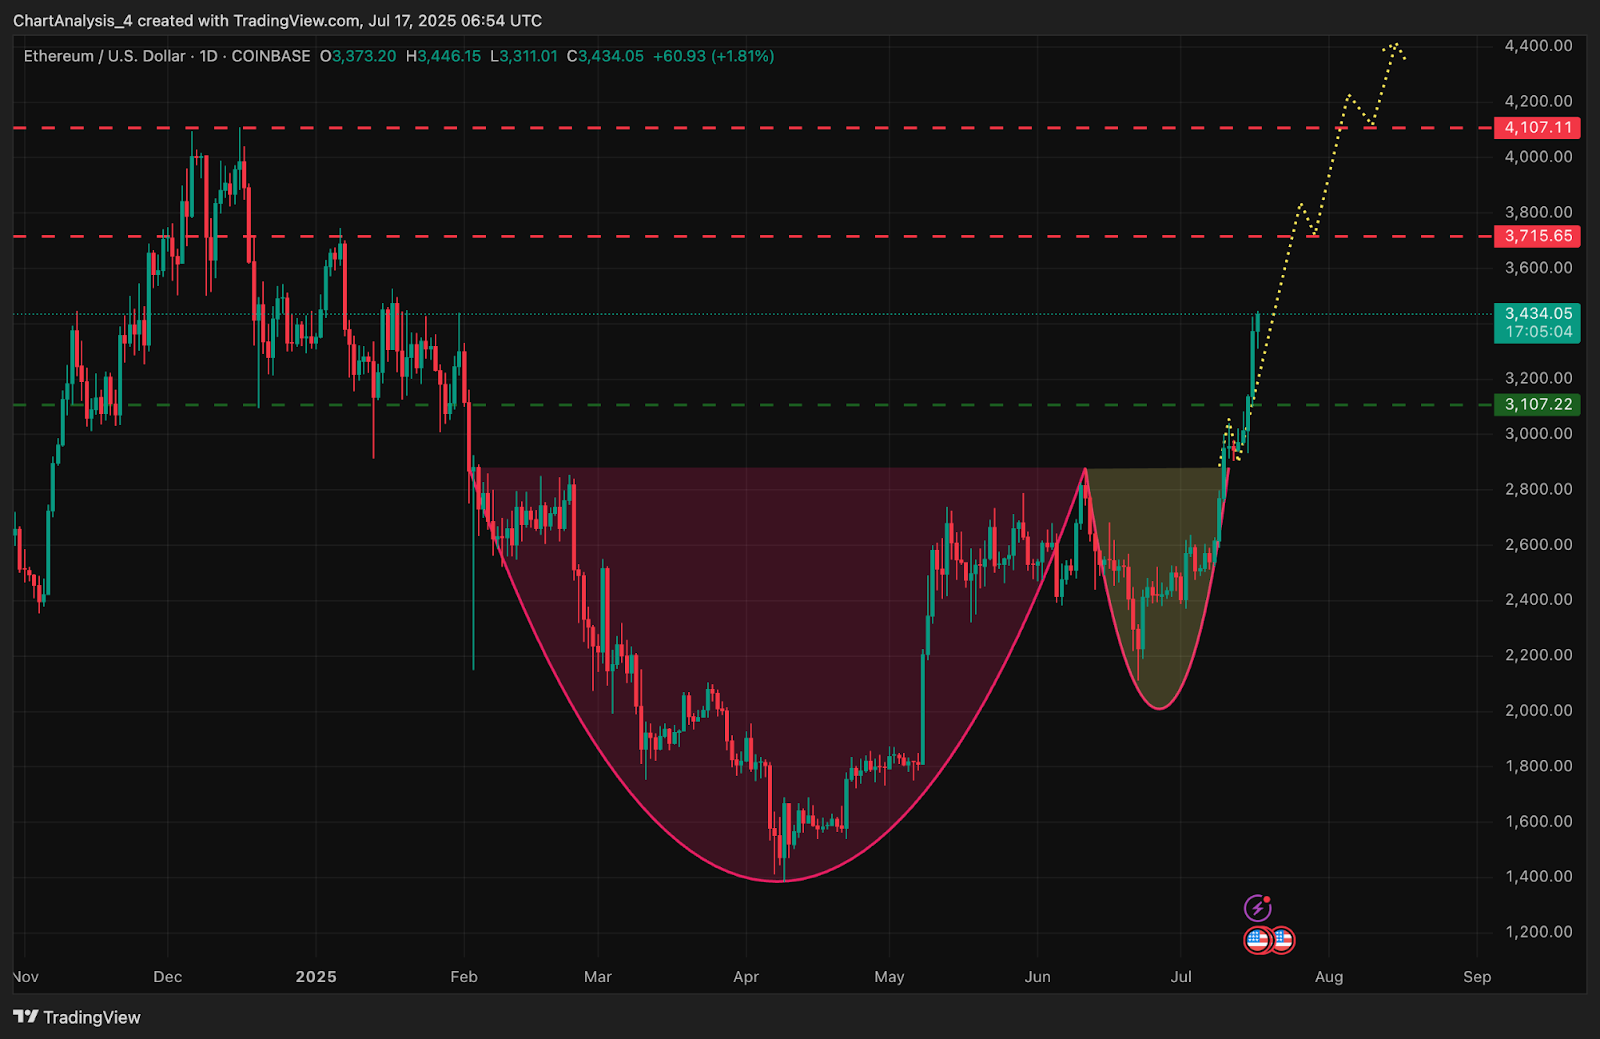
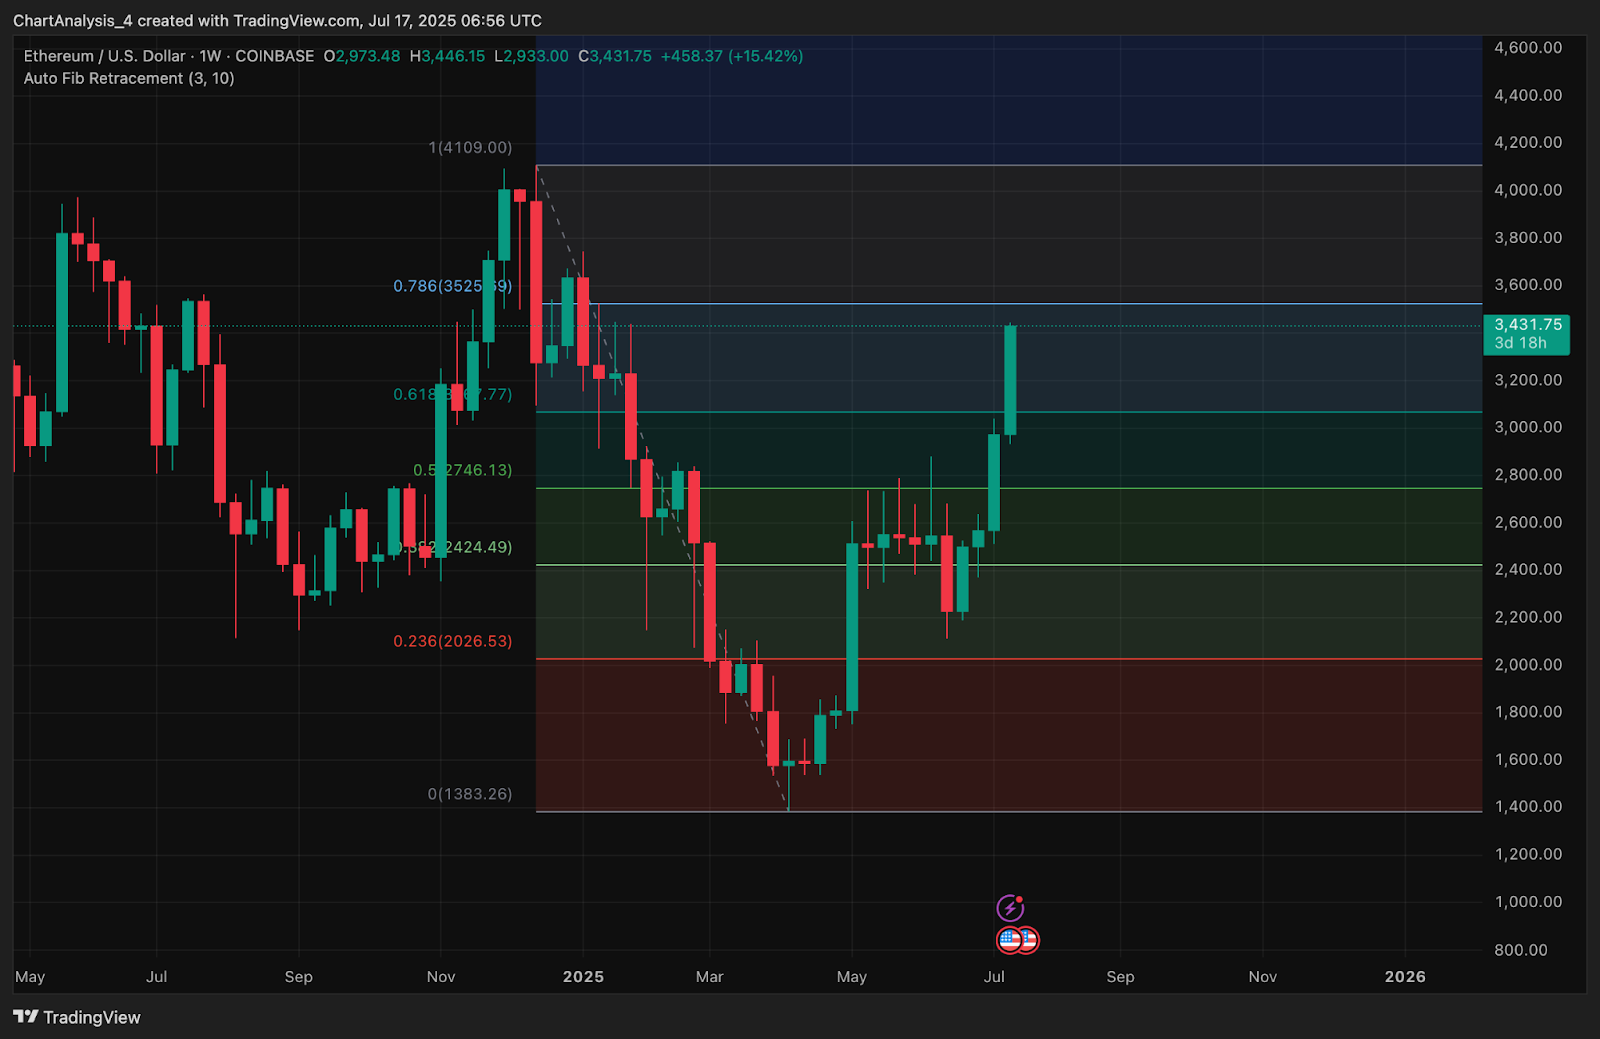
The daily chart shows a clear breakout above the handle structure of the large cup and handle pattern, with Ethereum price climbing from the $3,100 neckline into open air. This pattern confirms a structural bullish reversal with projected targets between $3,700 and $4,100 based on measured move theory. The weekly chart also reveals a clean breach of the 0.618 Fibonacci retracement at $3,177, with ETH now moving toward the 0.786 Fib level at $3,525.
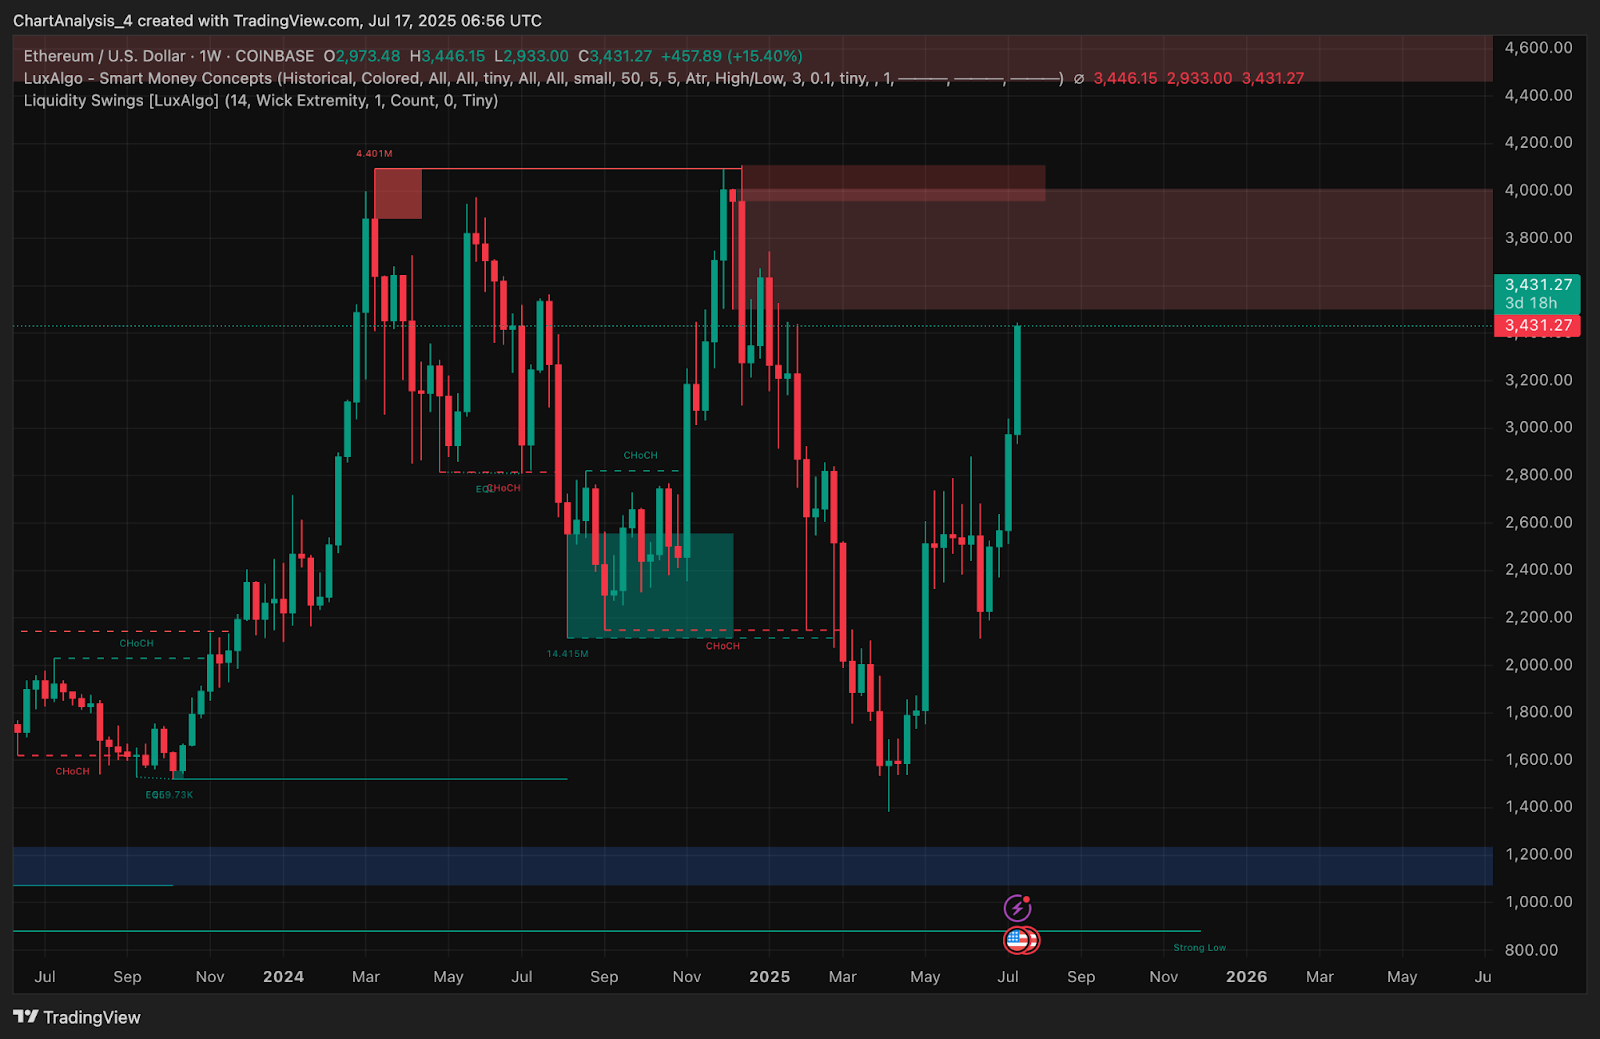
From a volume and structure perspective, price has invalidated the previous CHoCH (change of character) and reclaimed major liquidity zones. The Smart Money Concepts chart shows a clean BOS (break of structure) above the prior weekly high, aligning with the start of an aggressive markup phase. As long as ETH sustains above $3,100, the bullish structure remains intact.
Why Is The Ethereum Price Going Up Today?
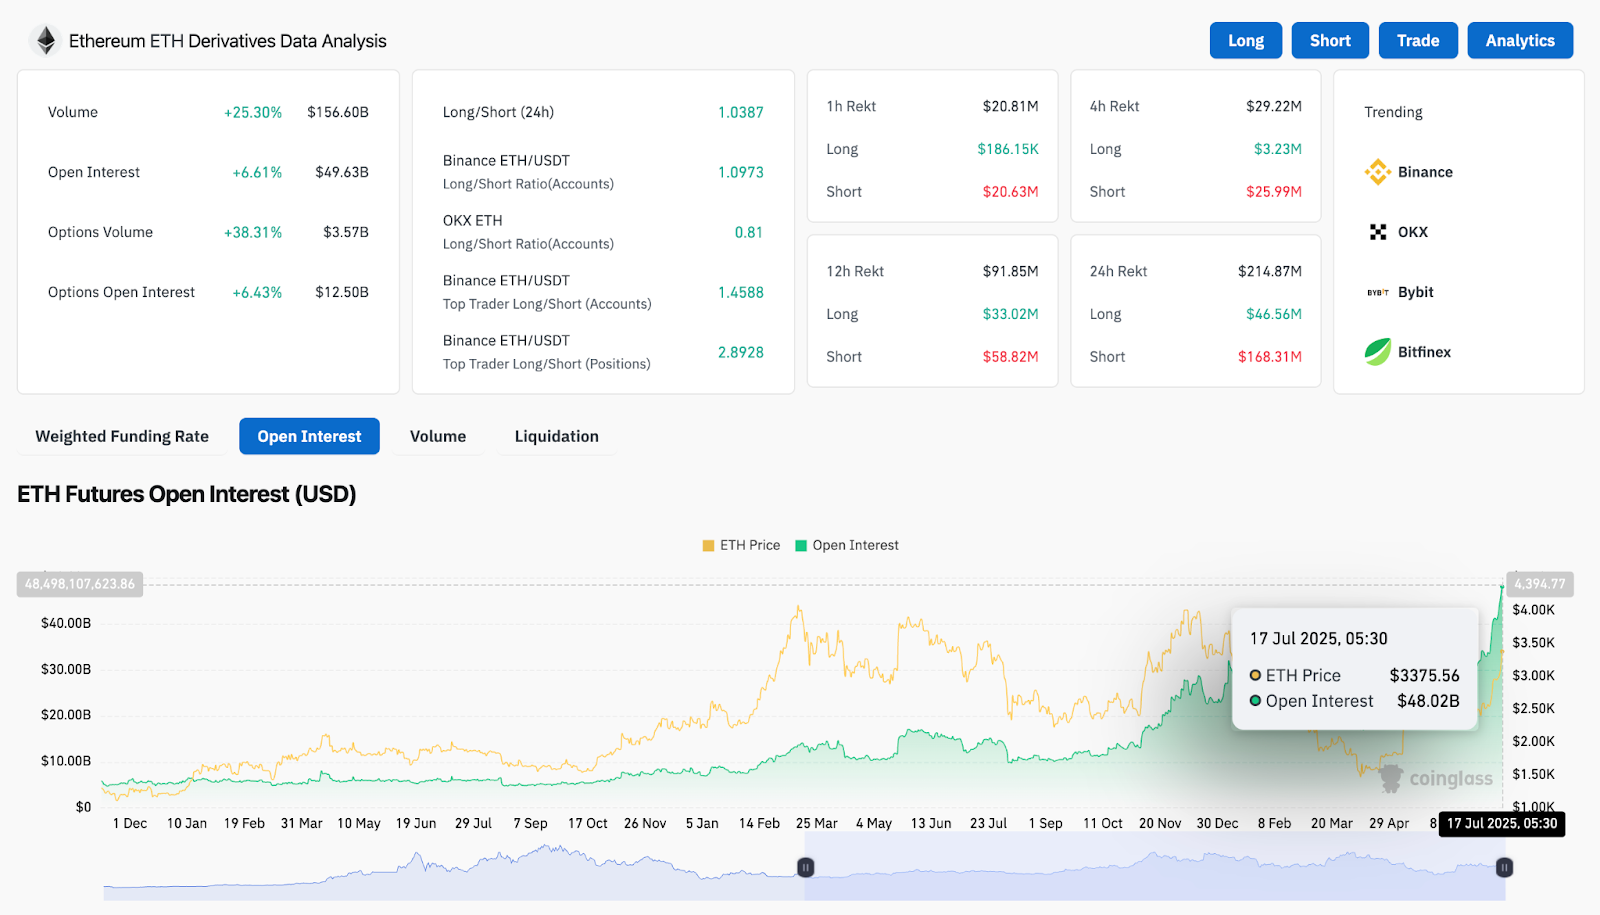
The main catalyst behind why Ethereum price going up today lies in the combination of technical breakout confirmation and rising speculative demand. Derivatives data from Coinglass shows a 25.30% surge in ETH futures volume to $156.6 billion over the past 24 hours, with open interest up 6.61% to $49.63 billion. This signals fresh long positioning and high conviction buying interest.
Long/short ratios are skewed bullish across exchanges. Binance accounts show a 1.0973 long ratio, while top trader positions on Binance are even more aggressively long at 2.89. The options market is also heating up with 38.31% higher volume and rising open interest, showing traders are betting on further upside. This confluence of technical and sentiment-based support is fueling the rally.
Bollinger Bands and EMAs Confirm Breakout Strength
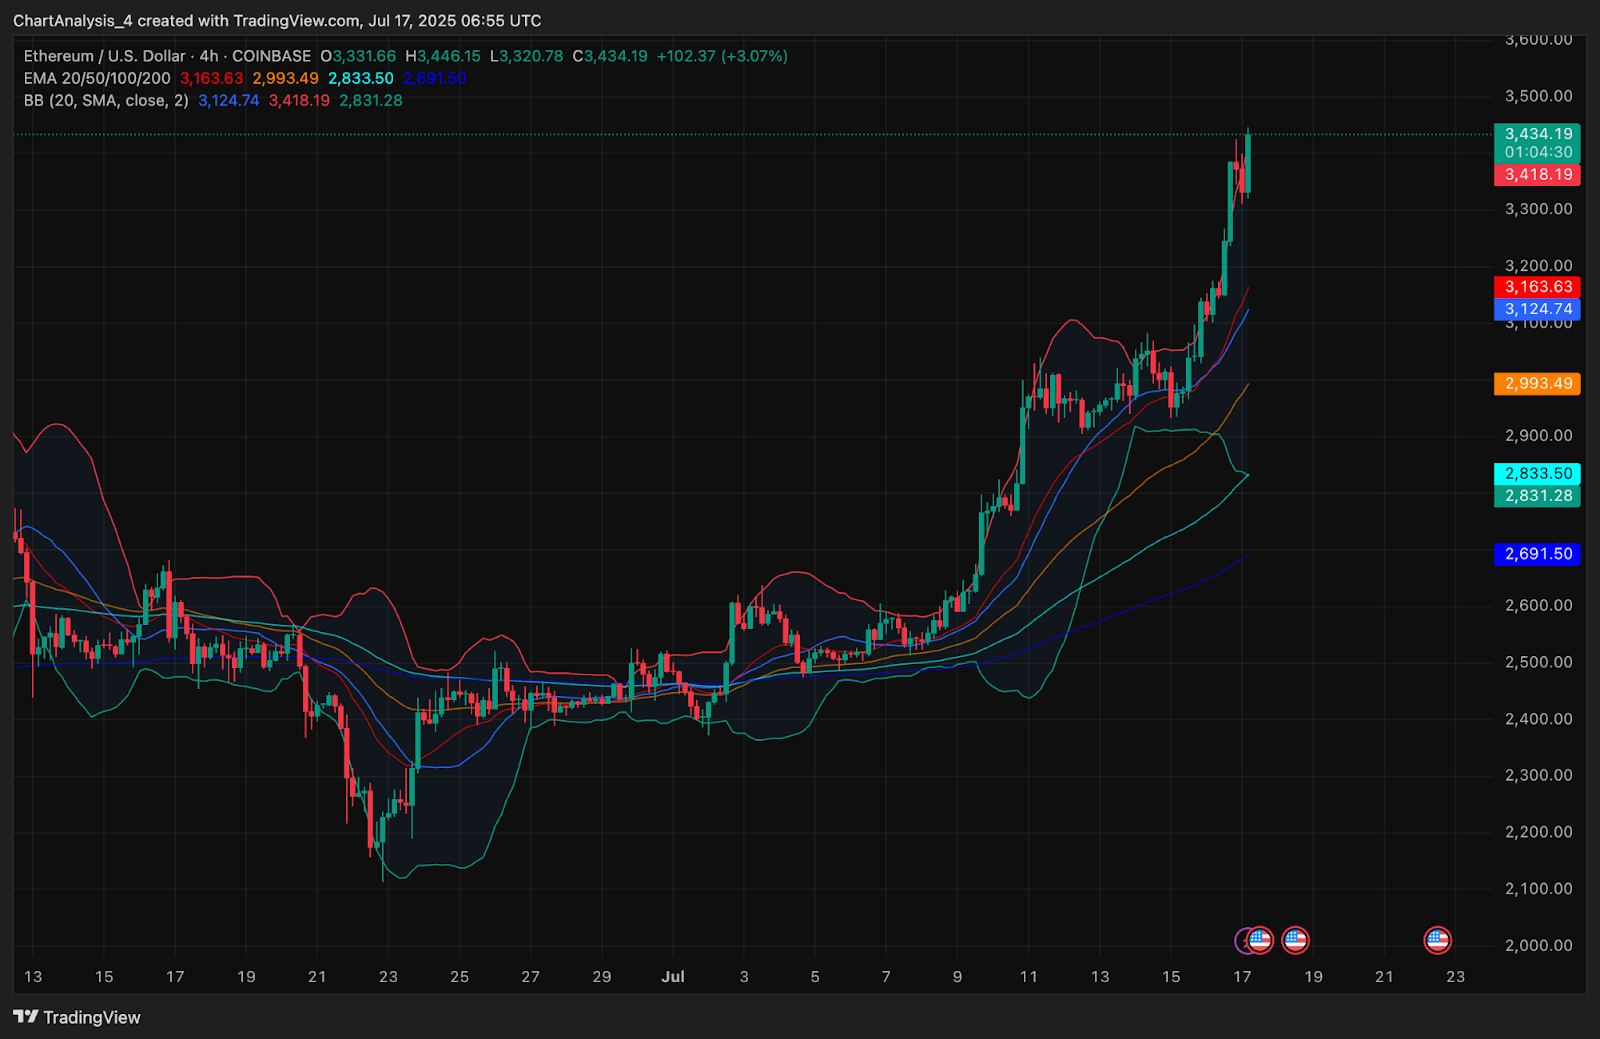
On the 4-hour chart, Ethereum price action is trading far above the 20/50/100/200 EMA cluster. All four exponential moving averages are stacked bullishly below current price, with the 200 EMA sitting at $2,691 and the 20 EMA now near $3,163. This structure provides a strong dynamic support base in case of short-term pullbacks.
The Bollinger Bands have expanded sharply, indicating elevated volatility after the breakout. Price has pierced above the upper band at $3,418, confirming aggressive price expansion. However, short-term consolidation may occur between $3,400 and $3,500 as traders take profits.
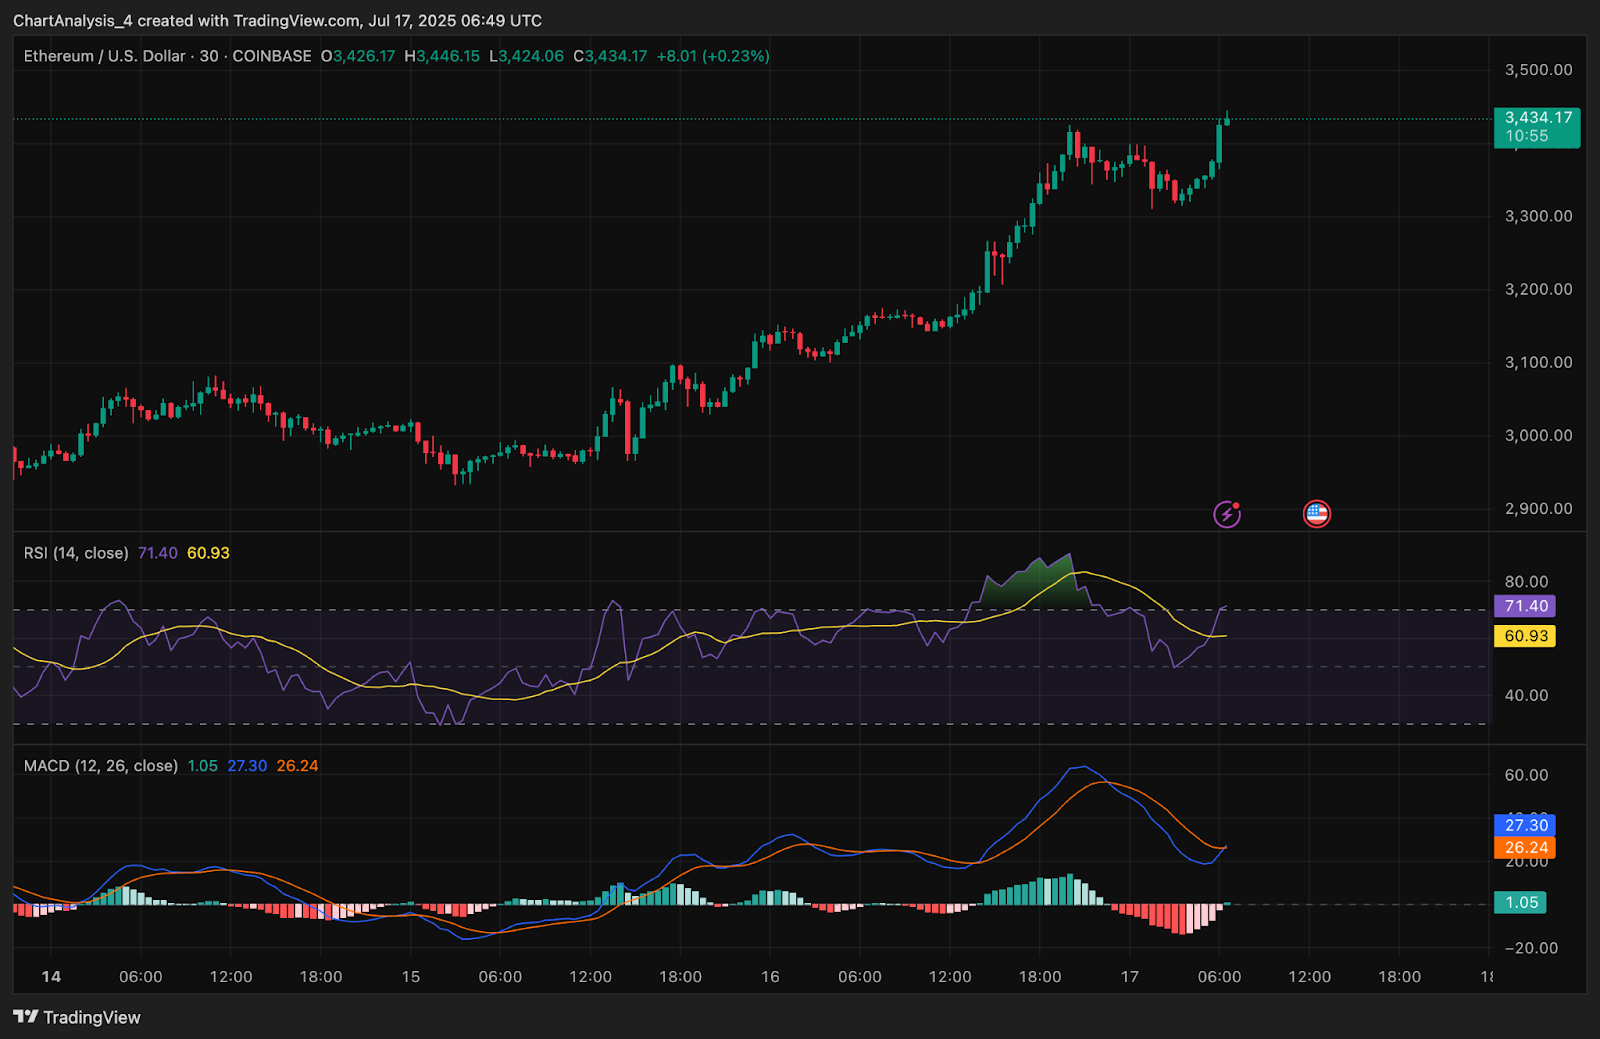
On the 30-minute chart, RSI has hit 71.4, entering overbought territory. MACD remains in bullish territory, though histogram bars are beginning to flatten, suggesting momentum could cool in the immediate term.
Ethereum Price Prediction: Short-Term Outlook (24H)
The short-term outlook for Ethereum price remains bullish, with immediate resistance seen at the $3,525 zone, aligning with the 0.786 Fibonacci level. A breakout above this region could accelerate the move toward $3,715 and $4,107, as outlined in the daily breakout projection. On the downside, support rests at $3,307 and the prior breakout level of $3,107.
Traders should watch for any consolidation near $3,450 to $3,500, which could offer a launchpad for the next leg higher. A drop below $3,307 would suggest temporary exhaustion but would not invalidate the larger bullish trend unless $3,100 breaks.
Ethereum Price Forecast Table: July 18, 2025
| Indicator/Zone | Level / Signal |
| Ethereum price today | $3,434 |
| Resistance 1 | $3,525 (Fib 0.786) |
| Resistance 2 | $3,715 |
| Resistance 3 | $4,107 |
| Support 1 | $3,307 |
| Support 2 | $3,107 (Breakout neckline) |
| EMA Cluster (4H) | Bullish, all stacked below price |
| Bollinger Bands (4H) | Expanded, price above upper band |
| RSI (30-min) | 71.4 (Overbought) |
| MACD (30-min) | Bullish, histogram flattening |
| Open Interest (24H) | $49.63B (+6.61%) |
| Futures Volume (24H) | $156.6B (+25.30%) |
| Long/Short Ratio (Binance Top) | 2.89 (Strong long bias) |
Disclaimer: The information presented in this article is for informational and educational purposes only. The article does not constitute financial advice or advice of any kind. Coin Edition is not responsible for any losses incurred as a result of the utilization of content, products, or services mentioned. Readers are advised to exercise caution before taking any action related to the company.


