


- czsamsunsb.eth gained 121.65 ETH in 2hrs from the $ezETH depeg event.
- ezETH faces a bearish trend and is likely to breach support levels soon.
- Renzo Restaked ETH’s technical indicators signal strong selling pressure.
In a financial manoeuvre, an Ethereum wallet address, czsamsunsb.eth, netted a profit of 121.65 ETH in just two hours. According to the report, the gain followed the depegging event of ezETH (Renzo Restaked ETH), a situation where the token’s value dropped from its pegged price.
<blockquote> “czsamsunsb.eth made 121.65 $ETH in just 2 hours after $ezETH(Renzo Restaked ETH) depegged!” </blockquote>
This event unfolded as the wallet holder invested 4,099 ETH to purchase 4,221 ezETH, subsequently turning an impressive profit of 121.65 ETH in a short time span.
Since then, the Renzo Restaked RTH market has been on a bearish trend. As of press time, the ezETH token is exchanging hands at a value of $3,177.90. This is an ebb of 1.20% in the last 24 hours, as exhibited by Coinmarketcap’s data.
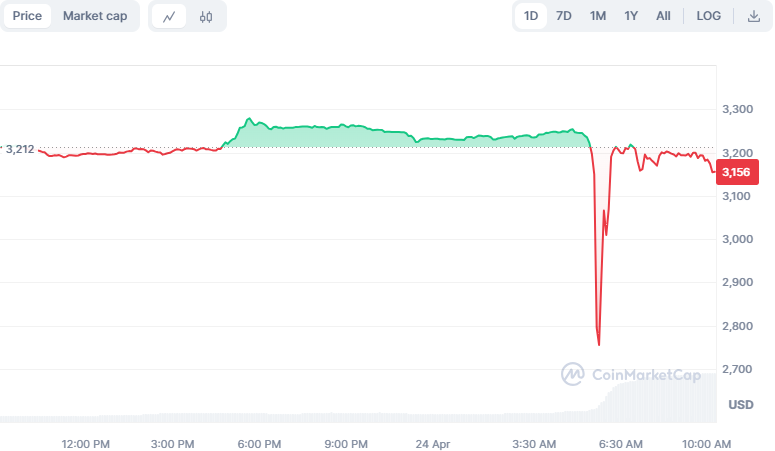
ezETH/USD 1-Day Chart (Source: Coinmarketcap)
On the contrary, its intraday market cap of $3.323 billion and trading volume of $698.709 million have seen an uptick of 0.53% and 628.24%, respectively.
ezETH/USD Price Analysis
In the four-hour chart analysis of the ezETH token, it is currently positioned near a key resistance level, signalling a potential shift in market dynamics. According to the chart, its trend indicates a bearish trajectory, as the token’s price has been consistently moving downward, targeting the next support level below. This movement suggests that ezETH might break through this support if the current momentum persists, potentially leading to further declines in its value.
Conversely, should the market sentiment shift and buyers regain control, there could be a possibility for the ezETH token to retest the resistance level it is currently facing. Overcoming this barrier could pave the way for a bullish breakout, marking a significant reversal from its current trend.
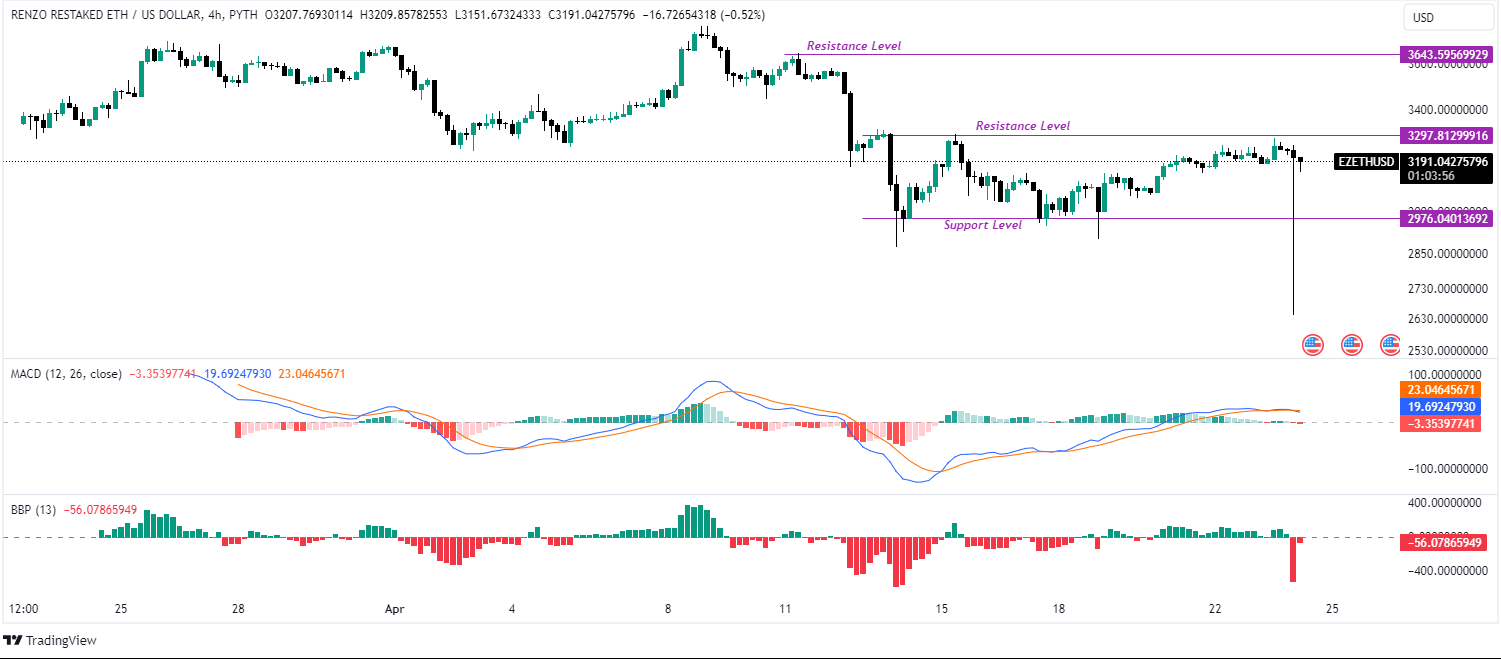
ezETH/USD 4-Hour Chart (Source: Tradingview)
The MACD (Moving Average Convergence Divergence) indicator is also showing a downward trend and is on the brink of a bearish crossover with the signal line at 19.692. This movement signals an increase in bearish momentum for the ezETH token, which could forecast a continued drop in price. Supporting this bearish outlook, the histogram bars on the MACD are growing in the red zone, pointing to significant selling pressure.
Additionally, the Bull Bear Power indicator aligns with the negative sentiment, trading below the zero line with its bars expanding in the red zone. This pattern underscores a strong bearish sentiment in the market and suggests a high probability of ongoing price reductions for the ezETH token in the near term.
Disclaimer: The information presented in this article is for informational and educational purposes only. The article does not constitute financial advice or advice of any kind. Coin Edition is not responsible for any losses incurred as a result of the utilization of content, products, or services mentioned. Readers are advised to exercise caution before taking any action related to the company.


