


- The bullish trend in the CHZ market fades after hitting resistance at $0.1394.
- Indicators imply that the bear rule in the CHZ market is far from over.
- CHZ price drops by more than 8% as bulls despair.
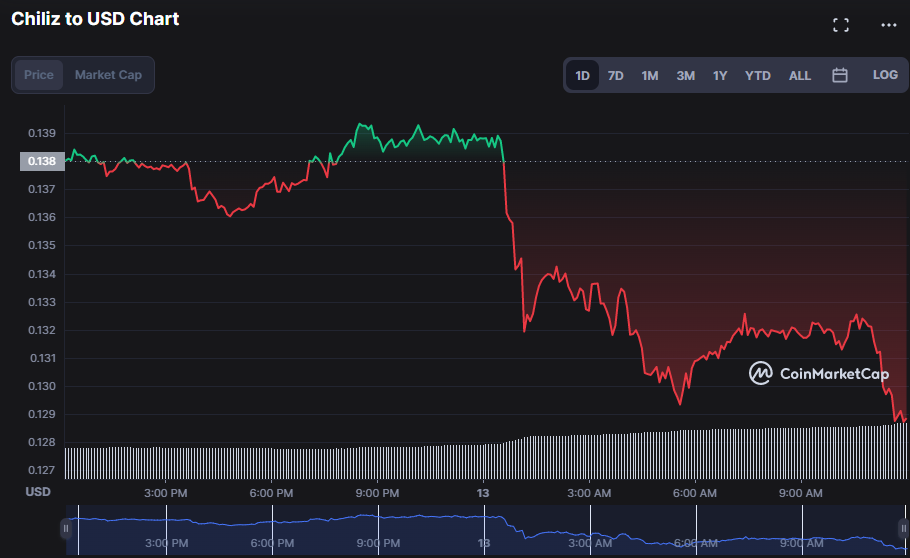
Bullish efforts to recoup market share in Chiliz (CHZ) during the previous 24 hours have been rendered void after hitting stiff resistance at $0.1394. At the time of writing, the negative pressure has caused the price of CHZ to fall 8.32% to $0.1265.
The CHZ market value has dropped from $919,924,961 to $842,607,675 (a loss of 8.32%) in the last day due to the current negative trend. In contrast, 24-hour trading volume increased by 94.69% to $126.526.805. Despite the pessimistic view in the Chiliz (CHZ) market, investors are confident that positive initiatives will ultimately recoup lost market share and propel the CHZ price to new heights.
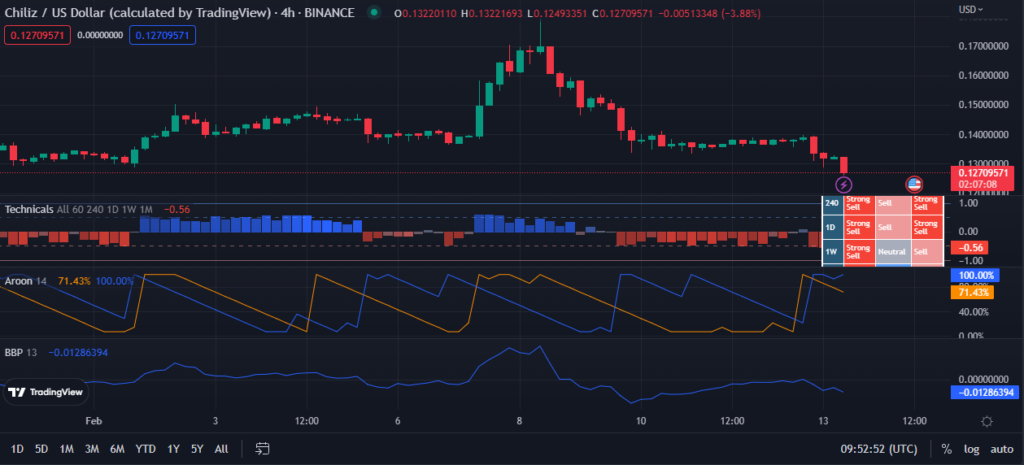
With a “strong sell” signal of -0.56 on the CHZ price chart’s Technical Ratings indicator, a decline in CHZ’s value may prolong during the next trading session.
Since the Aroon up is 100.00% and the Aroon down is 71.43%, this is a bearish crossing, signaling that bears are in charge of momentum and that the trend will most likely continue in the same direction. As investors unload their CHZ holdings, the price of CHZ will probably fall soon due to this trading activity.
The Bull Bear Power (BBP) is pointing south, showing a reading of -0.01285470, consistent with a bearish trend and the expectation of further price declines in CHZ. This trend diminishes traders’ optimism of a bullish reversal in the near term.
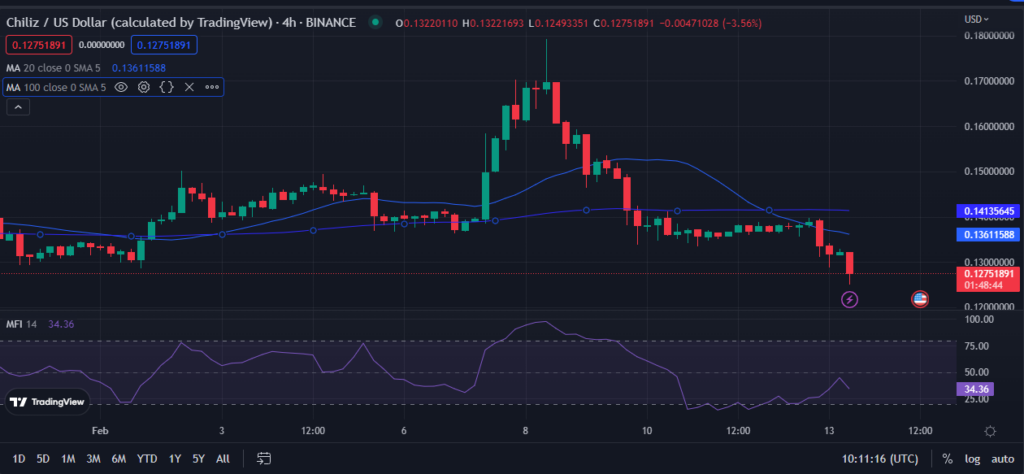
The 100-day MA crosses above the 20-day MA, indicating that the present negative trend will persist in the market for some time. When the 100-day MA crosses over the 20-day MA, the long-term bearish trend has surpassed short-term volatility and will continue to pull the market lower. This bearish crossing reflects on the 4-hour price chart with readings of 0.14134958 and 0.13608472.
Because the price drops below both MAs, it verifies that bears are in charge of the market, and traders can anticipate the trend to stay negative until the price breaks above both MAs.
With a Money Flow Index (MFI) score of 34.39 and heading south indicates substantial negative pressure in the market as capital withdrawals outweigh capital inflows, driving the price down. However, this clearly shows that the market’s negative attitude is likely to alter once the MFI returns above 50, suggesting a shift in the balance of buying and selling pressure.
CHZ bulls must push prices higher to reverse the current negative trend and turn resistance into support.
Disclaimer: The views and opinions, as well as all the information shared in this price analysis, are published in good faith. Readers must do their own research and due diligence. Any action taken by the reader is strictly at their own risk, Coin Edition and its affiliates will not be held liable for any direct or indirect damage or loss.
Disclaimer: The information presented in this article is for informational and educational purposes only. The article does not constitute financial advice or advice of any kind. Coin Edition is not responsible for any losses incurred as a result of the utilization of content, products, or services mentioned. Readers are advised to exercise caution before taking any action related to the company.


