


- Bullish momentum continues building up in FTM prices.
- Bulls target $0.2206 and $0.2462 in the short-term.
- A strong support level has been established at $0.1834.
The cryptocurrency market has been volatile over the past few weeks, with major coins like Bitcoin and Ethereum experiencing huge price swings. However, one coin that has bucked this trend is Fantom, which has been trading on the green for the past few days.
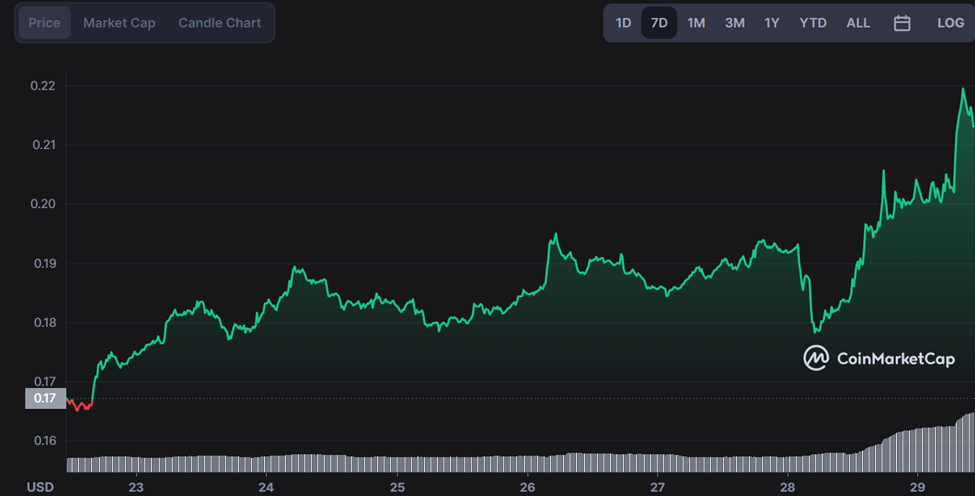
The coin has been gaining bullish momentum in recent weeks, seeing its weekly price climb to $0.2184 last week. The most notable move was seen today when FTM experienced a 16% jump. Fantom is trading at $0.212, with a trading volume of $197,517,601.49.
In a series of bullish moves, Fantom has climbed to $0.2184 and is facing a strong rejection at the price level of $0.2206. This means that we are likely to see some profit-taking as traders prudently book their profits, which could lead to a pullback.
At the same time, FTM is trading inside an ascending channel pattern in the last 7 days, which means that there is strong support at $0.2026 on the downside. A break below this level could lead to another correction in prices. However, the weekly RSI is at 67, which indicates that the bullish momentum is intact and we could see another push to $0.2206 before a significant correction occurs.
The medium-term outlook for Fantom remains bullish, with prices expected to peak at $0.5122 in the next few weeks. To achieve this, the cryptocurrency will have to break above key price resistance levels of $0.2206 and $0.2790 in the near term.
The technical indications on the 4-hour chart are positive, as the 50-day EMA is about to cross above the 200-day EMA. This indicates an upcoming bullish crossover and could trigger more buying pressure in Fantom.
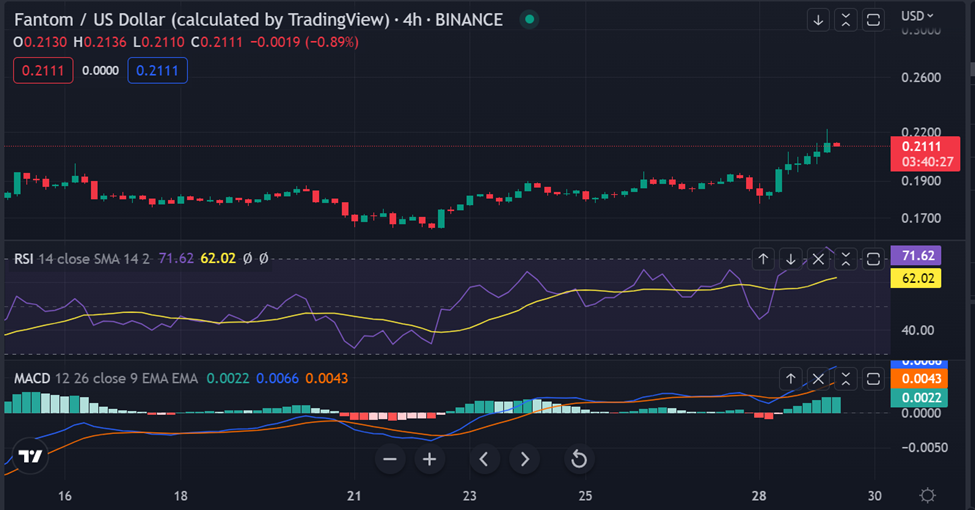
However, the short-term outlook for FTM remains bearish with prices testing the $0.2026 support level, which is a crucial price level. The coin is likely to find strong buying interest at this level, as it could lead to a bullish rally toward $0.2206 in the near term.
The Moving Average Convergence Divergence (MACD) is also showing a positive divergence, as the MACD line has crossed above the signal line. This could pave the way for continued upward pressure in FTM, resulting in another push to $0.2206 or higher.
On the downside, a break below the ascending channel pattern could lead to a correction toward $0.2026 in the short term. The bulls will need to sustain above $0.2026 for consolidation and move to the next price level of $0.2206 in the near term.
Disclaimer: The views and opinions, as well as all the information shared in this price prediction, are published in good faith. Readers must do their research and due diligence. Any action taken by the reader is strictly at their own risk. Coin Edition and its affiliates will not be held liable for any direct or indirect damage or loss.
Disclaimer: The information presented in this article is for informational and educational purposes only. The article does not constitute financial advice or advice of any kind. Coin Edition is not responsible for any losses incurred as a result of the utilization of content, products, or services mentioned. Readers are advised to exercise caution before taking any action related to the company.


