


- Fantom price recorded a 1.02 percent increment today and is currently trading at $0.2049.
- Price rebounded after an extended period of decline and has been consolidating within the last 24 hours.
- If bulls continue in the market, Fantom’s price could increase toward the $0.2063 resistance level.
Fantom price analysis reveals FTM/USD has recovered fine during today’s trading session. The digital asset has been range-bound within the last 24 hours and is currently trading at $0.2049 as of press time. The bullish momentum has benefited the buyers to a good extent as the coin’s value has improved with a notable rise in price value. Bulls toppled the resistance present at $0.2026 yesterday, and today they are aiming for $0.2063 resistance as their next target, as further improvement is also expected.
The 1-day price chart for Fantom price shows the cryptocurrency has been advancing unboundedly since earlier today, which is a moment of encouragement for the buyers. The price has been elevated up to $0.2049 in the last 24 hours, gaining more than 1.01 percent value, as the bulls have been maintaining their upper position proficiently. The price has been able to go above the moving average (MA) value as well, which is going at the $0.2023 level for the one-day price chart.
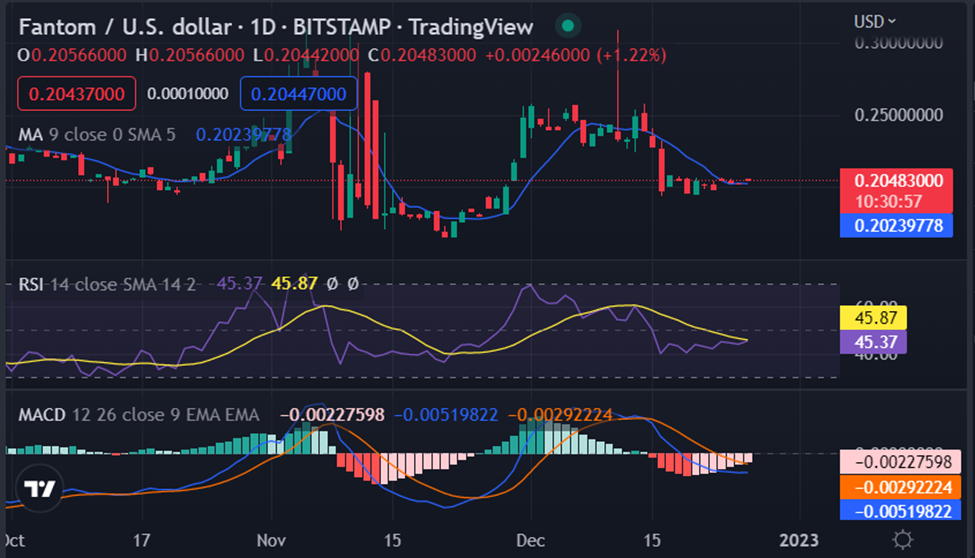
The Relative Strength Index (RSI) score has reached near the border of the oversold center line of the neutral zone at index 45.87, with its upward curve indicating solid buying activity in the market. The MACD indicator is showing a bullish divergence as the MACD line has been trading above the signal line.
The four-hour FTM chart is showing signs of an upswing as the price has increased remarkably during the day. The bullish momentum has been intensifying over the past few hours again, and the price has been progressing upward till the last hour. The moving average has moved above the SMA 50 curve and has reached $0.2048, which is a further bullish indication.
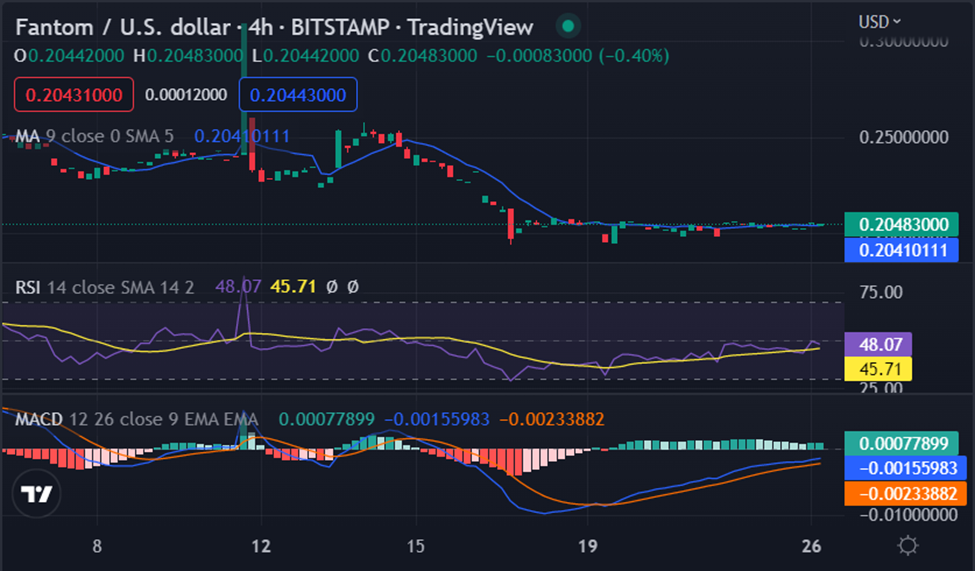
The RSI score is increasing again as the price is going up again due to the recent bullish activity in the market. The RSI indicator shows a reading of 45.71 near the overbought range on the 4-hour chart. The MACD indicator has been showing a bullish divergence as the histogram is in green, and the MACD line is trading above the signal line.
To sum up, the FTM/USD pair has been trading in a highly bullish state, and it is expected to continue the same trend in the coming hours. The buyers have been able to break the resistance levels, and they are aiming for the next target of $0.2063.
Disclaimer: The views and opinions, as well as all the information shared in this price prediction, are published in good faith. Readers must do their research and due diligence. Any action taken by the reader is strictly at their own risk. Coin Edition and its affiliates will not be held liable for any direct or indirect damage or loss.
Disclaimer: The information presented in this article is for informational and educational purposes only. The article does not constitute financial advice or advice of any kind. Coin Edition is not responsible for any losses incurred as a result of the utilization of content, products, or services mentioned. Readers are advised to exercise caution before taking any action related to the company.


