
- Fantom price analysis shows a firm bearish trend.
- FTM has declined by 16.07% in the last seven days.
- The current support level is present at $0.215.
Recent Fantom price analysis indicates FTM has been on a declining trendline for the last month, with a price change from a monthly high of $0.2808 to the recent low of $0.227. FTM is down by 5.97% and is currently trading at $0.2217. Fantom fell by 40% to lows of $0.22 during the Terra Luna collapse and traded around the range of $0.20 to $0.25 for the next few months before recovering to $0.25 in the Q3 of 2022, which was on 14th August.
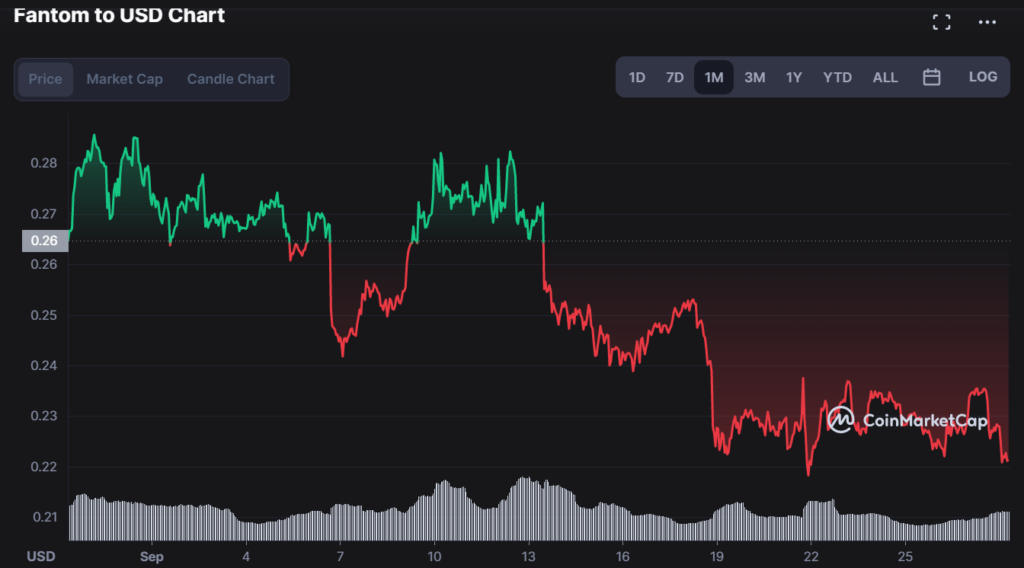
The recent lows were seen in June when LUNA collapsed, and the market was in turmoil. This suggests that FTM will continue struggling below $0.23 levels before a clear uptrend picks for the last quarter of 2022.
FTM currently has a trading volume of $109,538,474.40, up by 30 percent. The action intensifies as the asset trades below the daily 200 SMA, indicating bear dominance in the market. The market volatility is attributed to the bulging Bollinger bands. The lower band is touching $0.2051, the next level to watch.
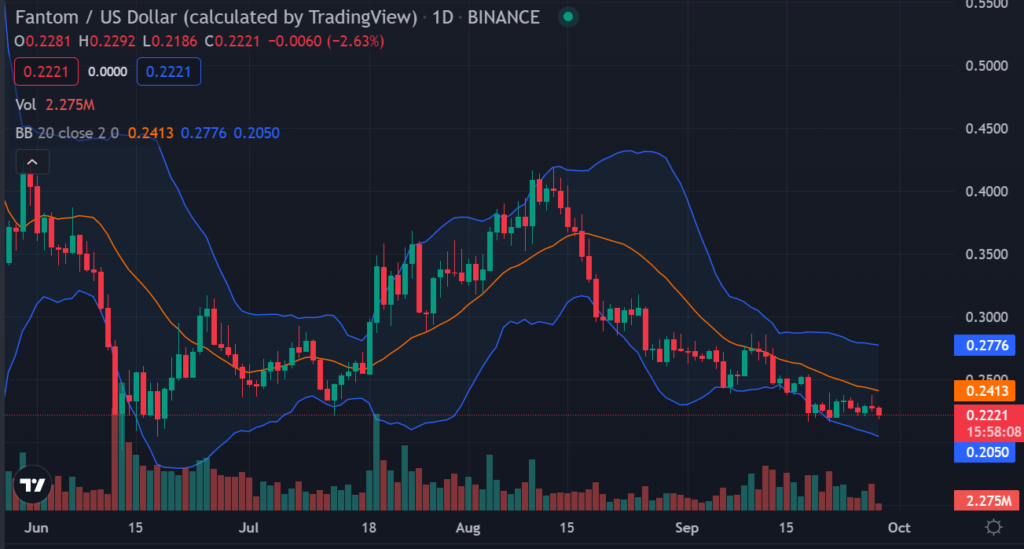
The bulls are trying to defend the psychological critical support level of $0.200. The candle sticks are well placed below the 200 EMA. The bulls need to push the prices above $0.23 to invalidate the bearish streak.
Further technical indicators show a bearish trend as the Relative Strength Index indicator is currently residing at 36 levels, almost oversold. The position of the RSI suggests the digital currency has more room for further downside as the bears increase their grip on FTM prices.
The MACD line is on the verge of crossing the red signal line towards the negative region, indicating the bearish momentum is increasing. However, a bullish reversal is possible as the MACD indicator has not yet crossed below the red signal line. A bullish crossover happens when the MACD is on the verge of crossing the red signal line.
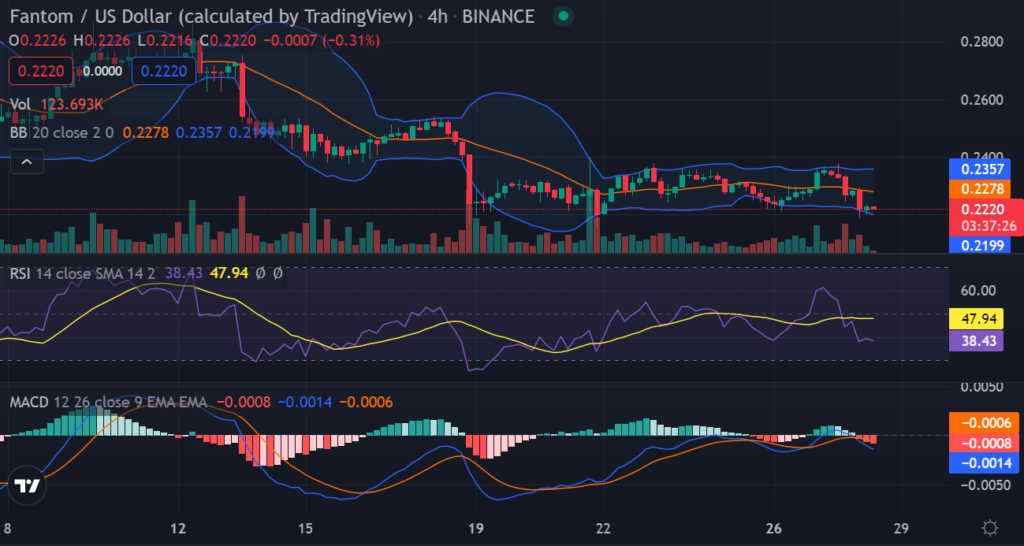
FTM has completed the bearish sentiment cycle on the four-hour chart, as all indicators are in the negative region. In this timeframe, the MACD line is well placed below the red signal line. All the moving average lines in this timeframe show bearish sentiment. The immediate resistance level is $0.23, and the Simple Moving Average SMA 100 level.
The overall market sentiment is bearish, and the recent break below $0.23 could see prices fall to $0.215 support in the near term. However, the $0.220 support level will likely provide buying pressure that could see prices rebound higher in the near term.
Disclaimer: The information presented in this article is for informational and educational purposes only. The article does not constitute financial advice or advice of any kind. Coin Edition is not responsible for any losses incurred as a result of the utilization of content, products, or services mentioned. Readers are advised to exercise caution before taking any action related to the company.
")


