


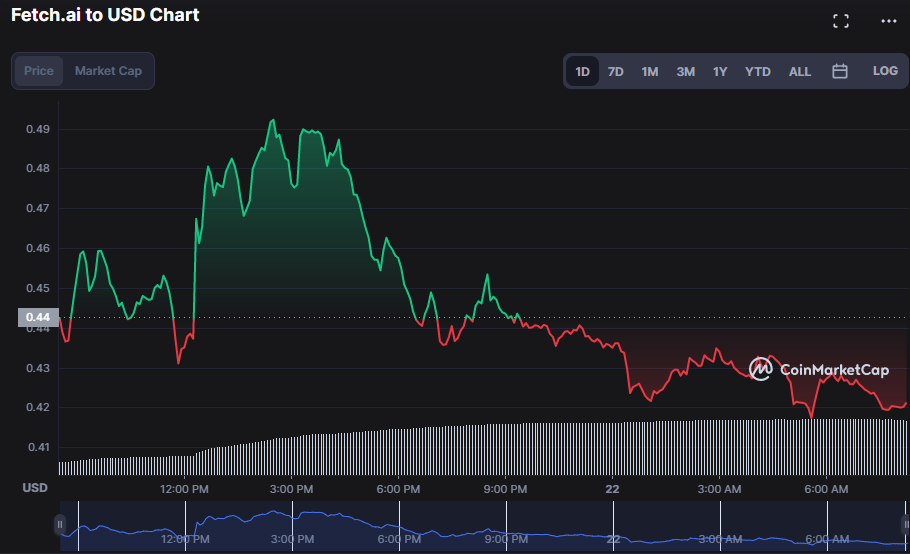
- After failing to breach resistance, FET bears seize control.
- In the previous 24 hours, bulls pushed the price to a 7-day high.
- Bearish crossover in the FET market weakens traders’ hopes for a sustained bull run.
While bulls have had the upper hand for most of the day, sellers have now emerged to reclaim control of the Fetch.ai market, which is currently heading down after encountering resistance at $0.4979. When bulls pushed the FET price to a fresh 7-day high of $0.4979 (the intraday excitement), the current slump in negative momentum manifested itself. The price of FET has fallen 4.2 %, down to $0.4221 at the time of writing, as the bear market continued.
Investors are on edge about the future of the FET price due to concerns that it may go below the $0.417 support level. As a result, the 24-hour trading volume surged by 335.32% to $306,353,837, while the market cap declined by 4.15% to $344,605,187. Due to the anticipated break of the FET price downward, traders have made advances to expand their market positions, leading to a spike in trading activity.
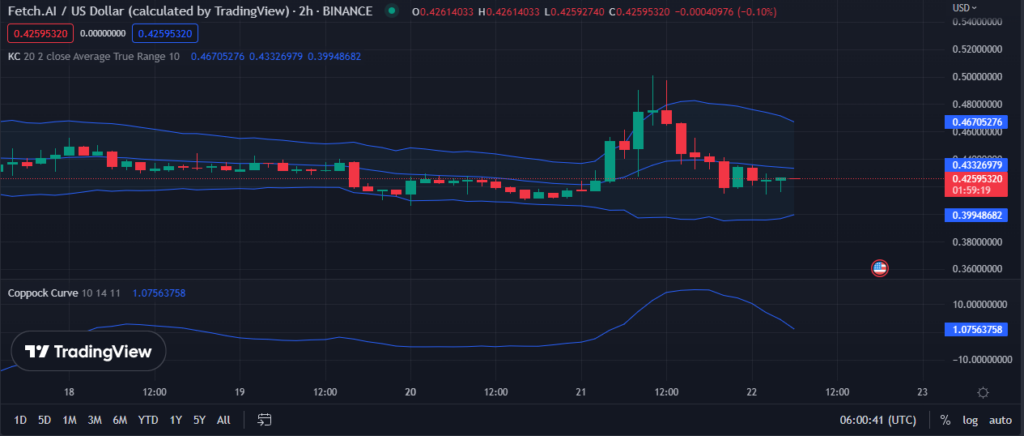
The bulging Keltner bands on the FET price chart, with the upper band at 0.47580886 and the lower band at 0.39653640, show the present state of the FET market, which is volatile but bearish.
This volatility implies that the market is ready for investment and that more profits are possible. Price action forms a massive red candlestick and moves toward the lower band, indicating a downward trend, implying that the FET price may continue to fall in the short term. This volatility may cause more significant swings in price action.
This motion, however, could be an opportunity for investors to profit from market uncertainty. If investors are willing to take on more risk, the promise of higher returns makes up for the risk of investing in the FET market.
The Coppock Curve, with a value of 1.05164833 and moving south, shows that, although the market is adverse in the near term, there is an expectation that it will begin to rise again in the mid-to-long term. This anticipation is because it may enter a long-term purchasing opportunity, which might be an appealing alternative for risk-tolerant investors. The potential benefits of investing in FET at this time are tempting, but investors should keep in mind that a long-term strategy is required to achieve the highest returns.
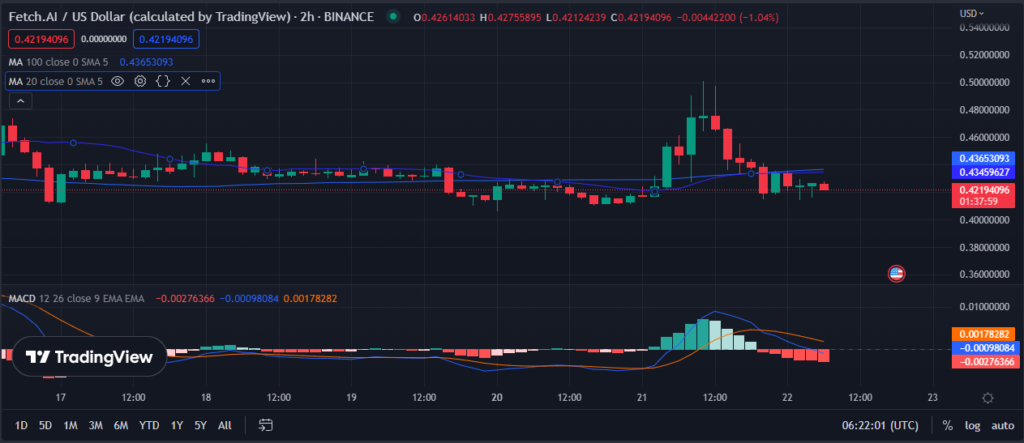
The 100-day MA crosses above the 20-day MA, indicating a bearish crossover, with values of 0.43657889 and 0.43483812, respectively on the 2-hour price chart. This movement represents FET’s underlying momentum, which shows increasing bearishness as the 100-day MA is higher than the 20-day MA. The bearish crossover signals a potential decrease in the FET’s underlying momentum, implying that the recent closing prices are lower than the average closing prices from earlier periods. This bear hand, backed by the difference in the two values of the MA, 0.00174077, suggests there has been a significant decrease in FETs’ momentum since the 100-day MA crossed above the 20-day MA.
Since price action has advanced below both MAs, investors may be confident that there will be a sustained decrease in FET’s underlying momentum, which may cause its price to fall and signal a bearish trend. This move cautions traders to consider entering short and exiting long positions, as the bearish crossover implies that the asset will decrease its price over the short term.
At a value of -0.00085759, the MACD line goes below its signal line and enters the negative area, indicating that purchasing pressure is diminishing and bearishness prevails. All of this points to a likely bearish outcome for FETs in the short term, which calls for a change in strategy by traders. The histogram backs this bearish concept, which displays a negative reading as it falls lower, indicating that the bearish movement is gaining momentum.
Technical indicators imply that negative strength in the FET market is increasing, which might lead to bearish dominance.
Disclaimer: The views and opinions, as well as all the information shared in this price prediction, are published in good faith. Readers must do their research and due diligence. Any action taken by the reader is strictly at their own risk. Coin Edition and its affiliates will not be held liable for any direct or indirect damage or loss.
Disclaimer: The information presented in this article is for informational and educational purposes only. The article does not constitute financial advice or advice of any kind. Coin Edition is not responsible for any losses incurred as a result of the utilization of content, products, or services mentioned. Readers are advised to exercise caution before taking any action related to the company.


