


- FET price stabilizes around $0.42, with bulls attempting to break resistance.
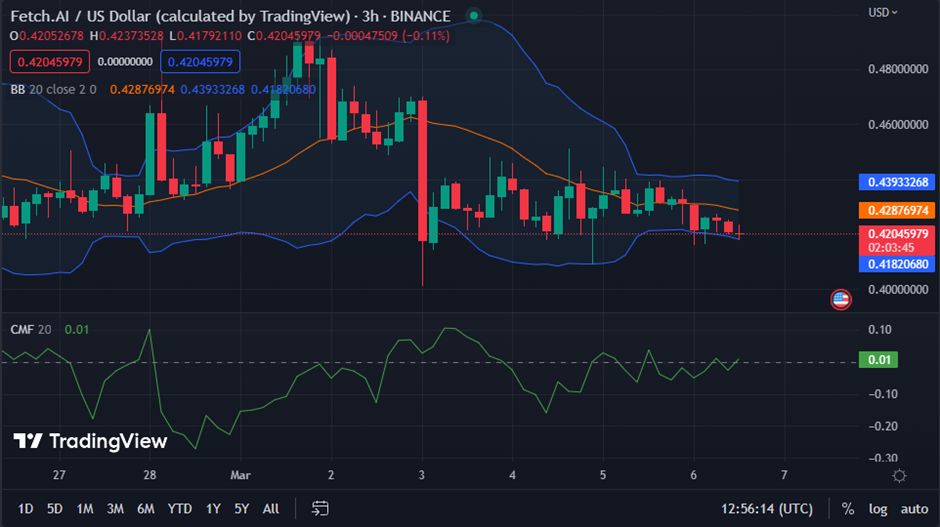
- Chaikin Money Flow suggests buying pressure is picking up.
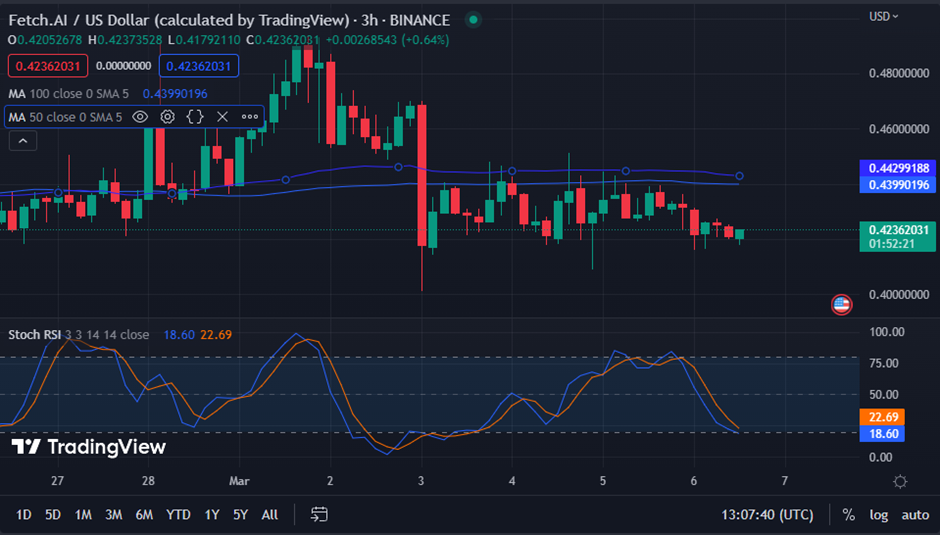
- Short-term MA is higher than longer-term MA, indicating buyer momentum.
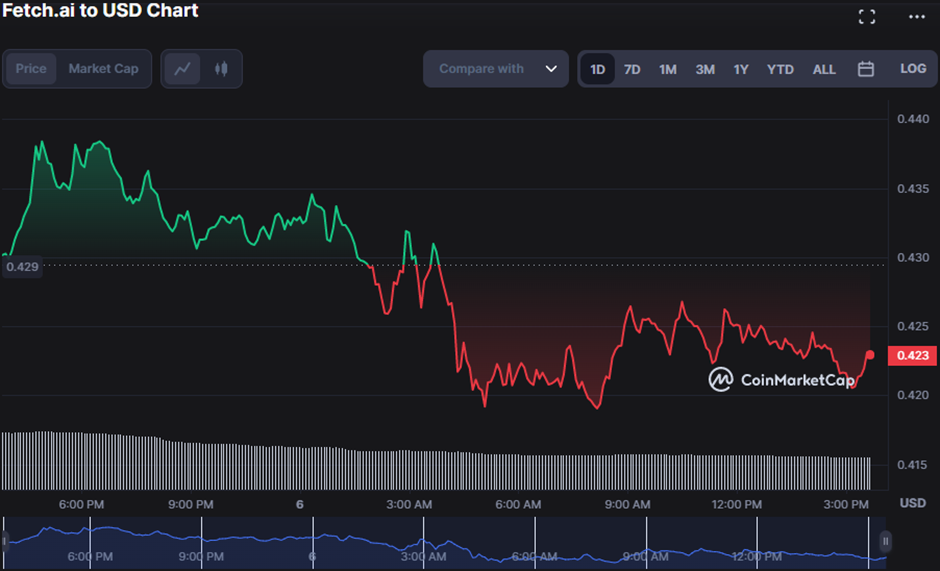
Bullish dominance of the Fetch.ai (FET) market has lately paused after encountering strong resistance at the intraday high of $0.4385. As a result of this development, the FET price fell to a low of $0.4183, but the market soon recovered.
The price of FET has been stabilizing around $0.42, with bulls attempting to break over the $0.43 resistance level. At the time of writing, the bears were still in charge, and FET was worth $0.423, with a decrease of 1.49% in 24 hours.
As a result of the drop, the market capitalization decreased to $346,434,876, and the 24-hour trading volume decreased to $59,128,282. In light of recent market volatility, this action may indicate that investors are only willing to make substantial transactions once conditions improve.
During the current downturn, the Bollinger bands on the FET price chart have moved south, with the upper band reaching 0.43924691 and the lower band at 0.41837824.
With the upper and lower bands serving as potential resistance and support levels, respectively, this action suggests that the price of FET is now undergoing a downward trend.
The Chaikin Money Flow (CMF) is trending north and has now crossed into the positive zone at 0.01, indicating that buying pressure is building. This swing might bring FET prices back up towards the top range. However, traders should monitor the trading volume to determine if the price change is durable or just a market fluctuation.
The negative trend in the FET market may be ebbing as the shorter-term moving average is higher than the longer-term moving average, with the 50-day MA reading at 0.44295490 and the 100-day MA touching 0.43989049.
This change indicates buyers are gathering steam and may continue to drive the price higher soon, although the volume and possible resistance levels should be watched closely.
The bullish prognosis has been called into doubt as price action has dropped below both MAs, suggesting a negative trend reversal may be approaching, prompting traders to consider placing stop-loss orders to protect their capital.
With a reading of 12.85 on the stochastic RSI and a subsequent move below the indicator’s signal line, the market is in the oversold zone, suggesting that the current bear market may be approaching its end. Such a development might signal an imminent bullish crossing, suggesting that the present downtrend may change direction.
After encountering resistance, the FET market shows signs of stabilization, but traders must remain vigilant for possible trend reversals and market fluctuations.
Disclaimer: The views, opinions, and information shared in this price prediction are published in good faith. Readers must do their research and due diligence. Any action taken by the reader is strictly at their own risk. Coin Edition and its affiliates will not be liable for direct or indirect damage or loss.
Disclaimer: The information presented in this article is for informational and educational purposes only. The article does not constitute financial advice or advice of any kind. Coin Edition is not responsible for any losses incurred as a result of the utilization of content, products, or services mentioned. Readers are advised to exercise caution before taking any action related to the company.


