


- FET price struggles to overcome resistance at $0.2513.
- Currently, negative indicators suggest a bearish market sentiment for FET.
- However, the Elder Force Index shows potential for positive momentum in FET.
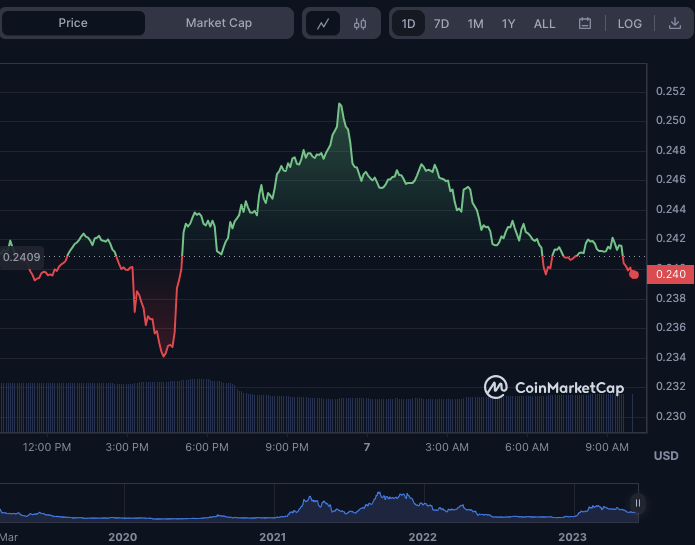
Despite a bearish start that saw the Fetch.ai (FET) price fall to a 24-hour low of $0.234, bulls reclaimed market dominance and pushed the price to an intra-day high of $0.2513. The bulls’ attempts to retake market control were admirable, but the resistance around $0.2513 was too much for them to overcome. Consequently, as of press time, the price had retraced marginally to $0.2399.
If negative momentum breaks through the intraday low of $0.234, the FET will find support around $0.221. However, if the bulls can push the price over the resistance level of $0.2513, the subsequent resistance would be $0.2667.
During the drop, the FET’s market capitalization and 24-hour trading volume plummeted by 0.61% and 22.40%, respectively, to $196,016,937 and $39,406,109.
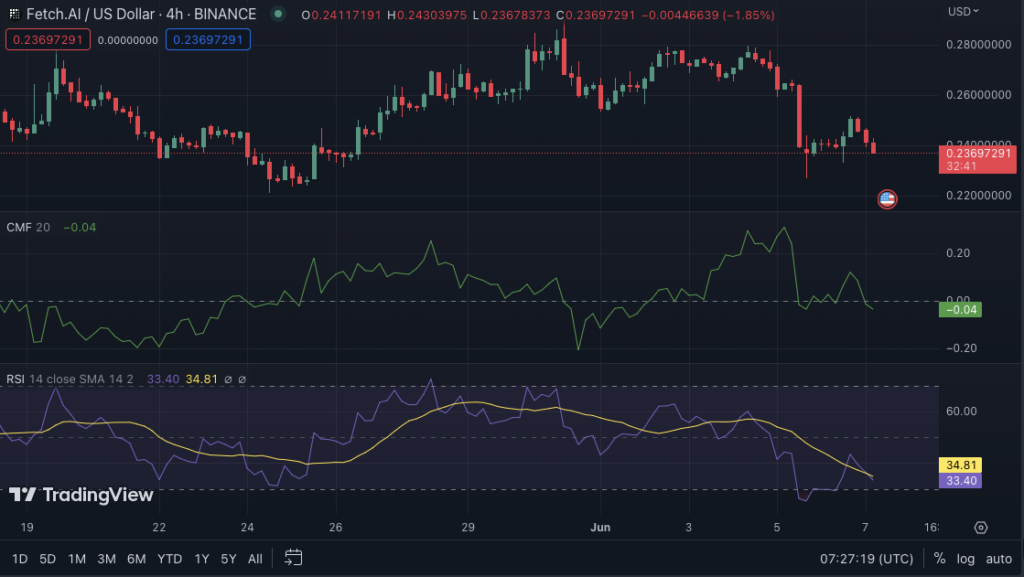
When the Chaikin Money Flow enters the negative territory, it indicates that selling pressure is building, and the price will fall short. As a result, the Chaikin Money Flow reading of -0.04 on the FET 4-hour price chart indicates that capital outflows are now outweighing inflows.
Traders and investors may see this as a negative signal and consider selling positions or refraining from investing at this time. If Chaikin Money Flow falls further, it may suggest a more pessimistic market mood.
With a value of 33.53, the Relative Strength Index (RSI) is sliding below its signal line, adding to the negative mood. This RSI level indicates the market is approaching oversold territory, which might lead to a more negative potential. If the RSI returns above its signal line, it may imply a movement toward a more positive mood.
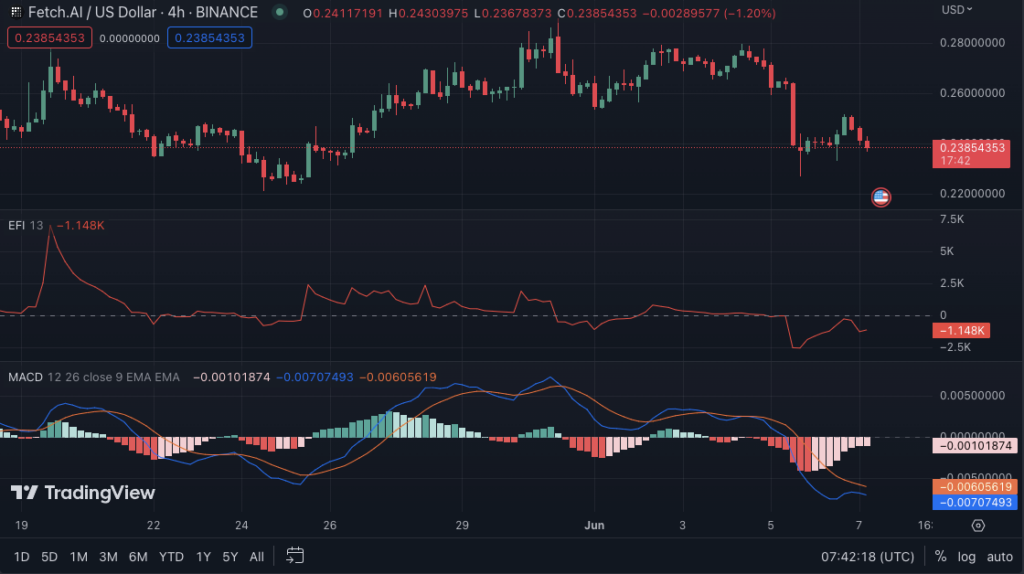
Investors use the Elder Force Index to gauge the strength of the upswing by comparing the number of equities advancing against those decreasing.
When the Elder Force Index rises, equities are in high demand, and buyers are in command of the market. As a result, the fact that the Elder Force Index on the FET/USD price chart is in the negative area with a value of -1.149k indicates that the market is under bearish pressure.
However, since it is increasing, the negative pressure may lessen and finally give way to positive momentum.
With a value of -0.00709470, the moving average convergence divergence (MACD) motion is in the negative area. This MACD trend indicates that the market is under intense selling pressure. If the MACD trend and histogram turn positive, it may indicate a possible turnaround.
In conclusion, despite initial setbacks, Fetch.ai (FET) remains poised for a potential market turnaround, with indicators suggesting a shift from bearish to positive momentum.
Disclaimer: The views, opinions, and information shared in this price prediction are published in good faith. Readers must do their research and due diligence. Any action taken by the reader is strictly at their own risk. Coin Edition and its affiliates will not be liable for direct or indirect damage or loss.
Disclaimer: The information presented in this article is for informational and educational purposes only. The article does not constitute financial advice or advice of any kind. Coin Edition is not responsible for any losses incurred as a result of the utilization of content, products, or services mentioned. Readers are advised to exercise caution before taking any action related to the company.


