


 Price Falls 33% in 7 Days: Is It Time to Buy the Dip?")
- FET struggles to break resistance at $0.1878 and hits a 90-day low of $0.178.
- A bearish grip continues as the FET market sees persistent downward pressure.
- MACD signals weakening bearish momentum, the potential for a market turnaround.
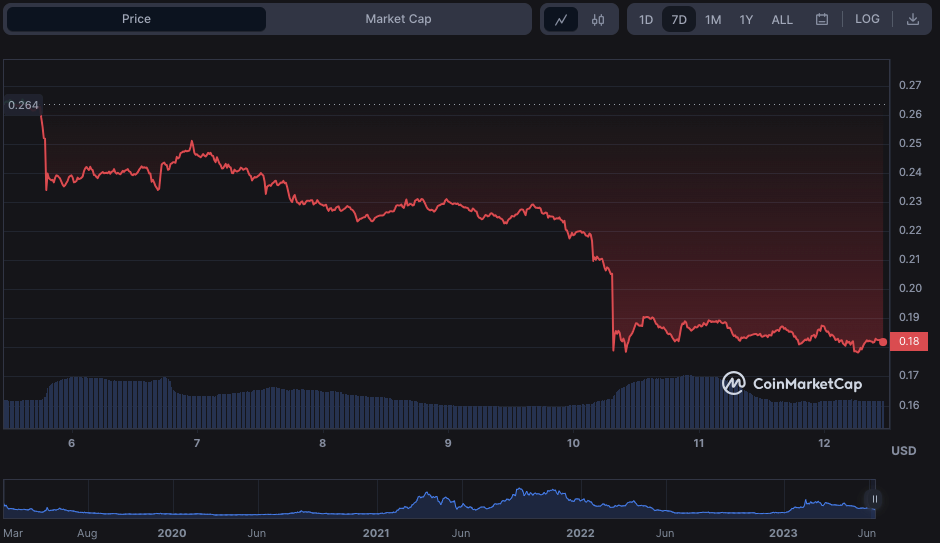
The Fetch.ai market has been under a bearish grip for the previous 7 days, with bulls unable to break above the intra-week high of $0.2513. The resistance at the 24-hour high of $0.1878 prompted a dip, eventually resulting in a 90-day low of $0.178 (a 33% dip from the week’s high).
The negative drop was still persistent as of press time, resulting in a 1.14% drop from its previous closing to $0.1824.
During the bull-bear pull, FET’s market capitalization and 24-hour trading volume declined by 1.36% and 13.63%, respectively, to $149,546,211 and $29,541,787. If bulls recoup market control and breach the $0.1878 resistance level, the next target for FET could be the $0.1925 level. However, if bears continue to dominate, the support level at $0.1775 could be tested.
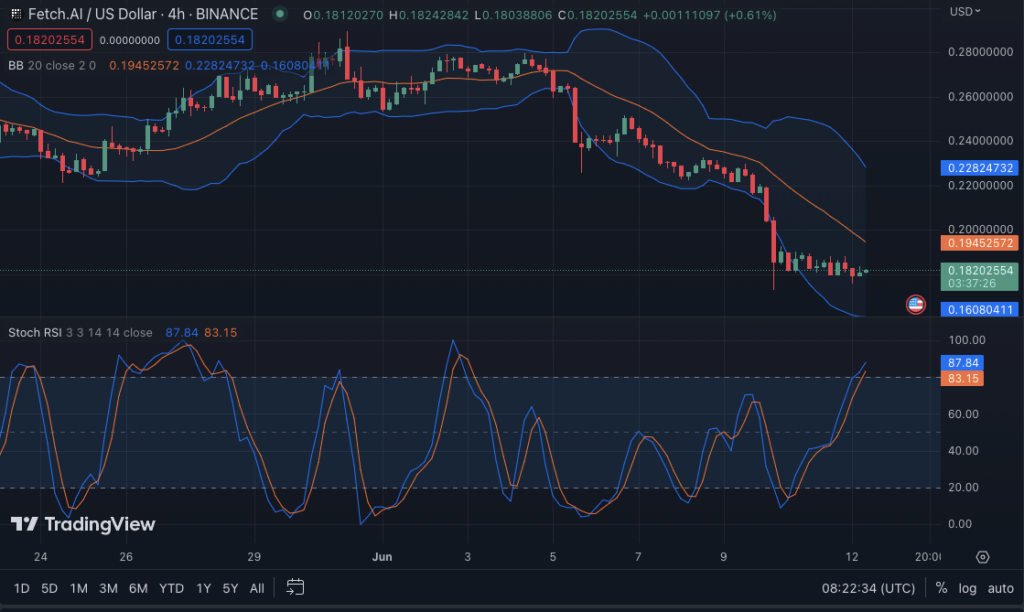
The Bollinger bands are broadening but heading south on the FET’s 4-hour price chart, with the upper band reaching $0.22827254 and the lower band at $0.16048439. This combination of expanding bands and southward movement in the market implies a bearish trend or probable selling pressure.
It indicates that the market is experiencing increased volatility and that the price is more likely to move towards or even break below the lower band.
The stochastic RSI reading of 84.89 indicates that negative momentum is strong and is expected to persist in the near future. An “80” or above value shows that FET is overbought, suggesting that selling pressure may persist or accelerate soon.
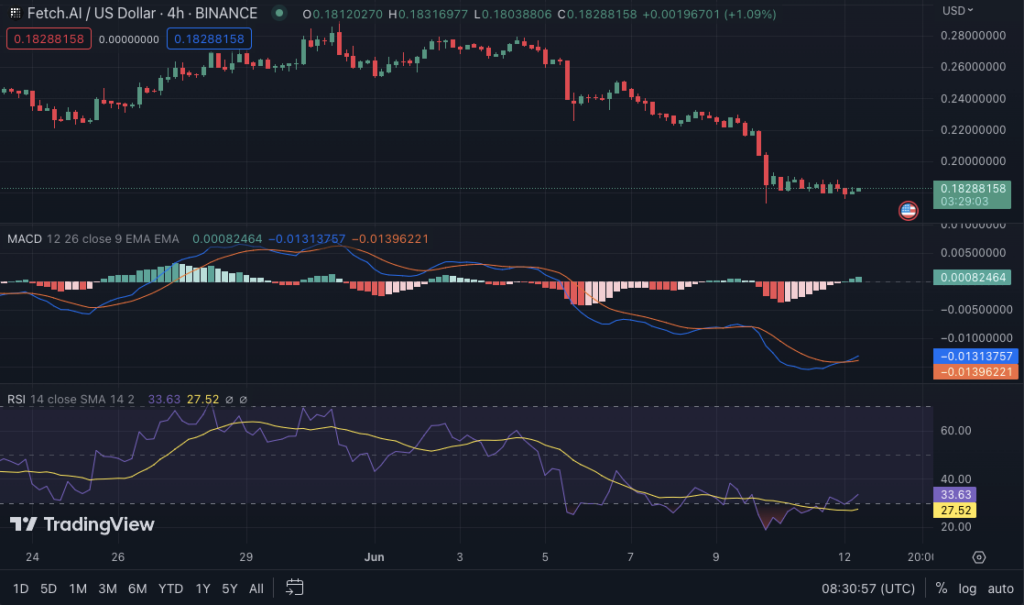
However, the MACD movement on the FETUSD price chart, as it crosses above its signal line and travels northwards with a value of -0.01322206, indicates that the negative momentum is starting to wane.
This might indicate a change in market sentiment towards a positive perspective. Adding to the optimistic view, the histogram moved into the positive zone, suggesting a rise in purchasing pressure.
With a value of 33.65, the Relative Strength Index is moving away from the oversold zone, indicating that the market is gaining momentum. If the RSI continues to rise, we may see further upside potential for this market. This indicates that the trend is changing upward, and buyers are gaining market control.
In conclusion, while the Fetch.ai (FET) market has been bearish, recent indicators suggest a potential shift in momentum with decreasing negative pressure and rising buyer interest.
Disclaimer: The views, opinions, and information shared in this price prediction are published in good faith. Readers must do their research and due diligence. Any action taken by the reader is strictly at their own risk. Coin Edition and its affiliates will not be liable for direct or indirect damage or loss.
Disclaimer: The information presented in this article is for informational and educational purposes only. The article does not constitute financial advice or advice of any kind. Coin Edition is not responsible for any losses incurred as a result of the utilization of content, products, or services mentioned. Readers are advised to exercise caution before taking any action related to the company.


