


- FTL has been on a bullish trend for the last 24 hours.
- Bulls struggle to surpass the 3.05 resistance level for a further upswing.
- Technical indicators show a bullish market trend set to continue in the short term.
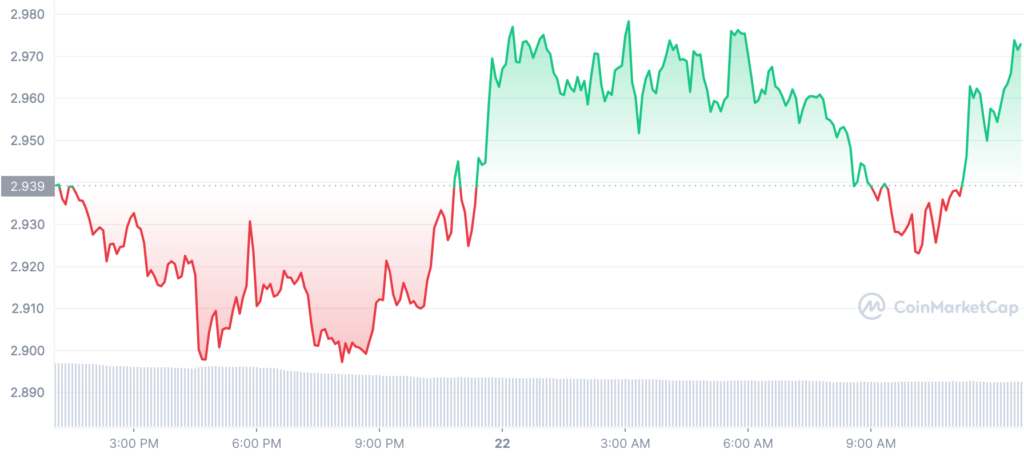
In the past 24 hours, Filecoin’s price fluctuated within a small range with a positive slant. The bull flag pattern on the cryptocurrency has developed between the crucial levels of $2.89 and $2.97.
By consistently making higher lows, the buyers have maintained their position above the crucial support level of $2.9 for the price. This reveals the underlying strength of the digital asset, which has been steadily increasing over the past 24 hours, rising from an intraday low of $2.8 to a high of $2.97.
FTL is currently up against a short-term barrier of around $3.05, which may make it difficult for purchasers to pass. If HBAR can break through this barrier, it might see an upside breakout and experience rising prices soon.
HBAR may maintain its bullish momentum and initiate an upside breakout by breaking over the MA50 short-term resistance line at $3.33. In addition, HBAR may pull back if it cannot overcome the $4.146 resistance level, returning to the price range between $2.4 and $2.63.
When analysing the technical indicators, the CCI is solidly moving in the positive zone, and the MACD line is above the signal line, indicating bullish momentum for HBAR. The Relative Strength Index (RSI), currently at 60, is pointing toward a positive trend soon.
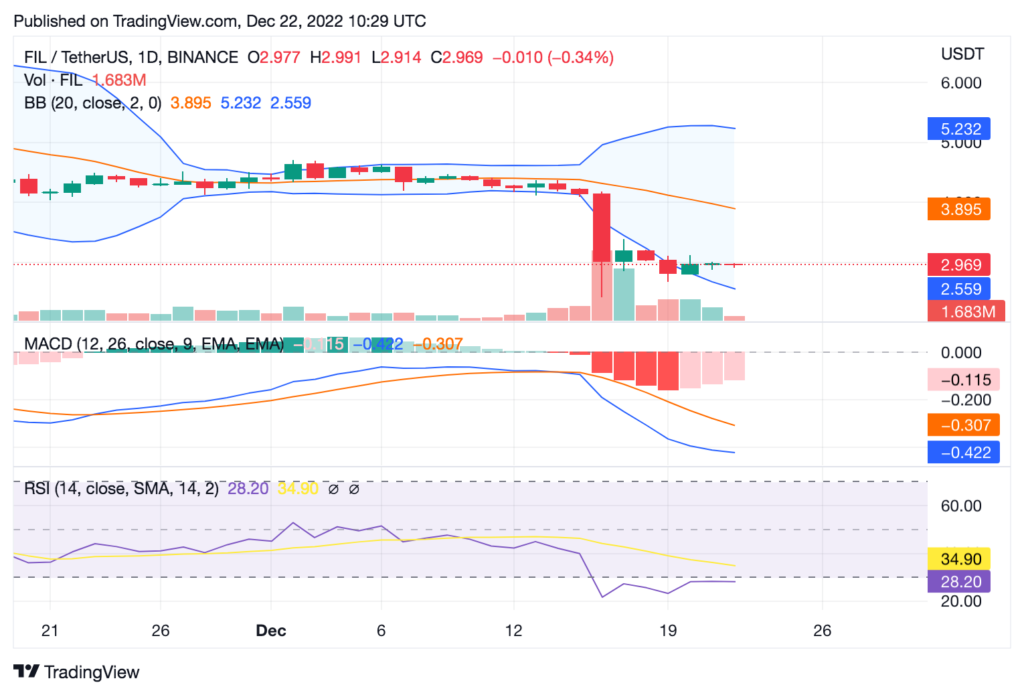
On the 1-day chart, the moving average (MA) is $2.94 below the price level.
The Bollinger band endpoints, with the top end at $5.202 representing resistance and the bottom end at $4.17 representing the most vital support, are heading straight ahead after steeply converging and forming a small tunnel, indicating low volatility.
The average of the Bollinger band is also below the $3.03 price level, highlighting the positive trend even more. Since the relative strength index (RSI) is nowhere close to the overbought zone, it’s currently at $28.20, and investors should feel safe making purchases.
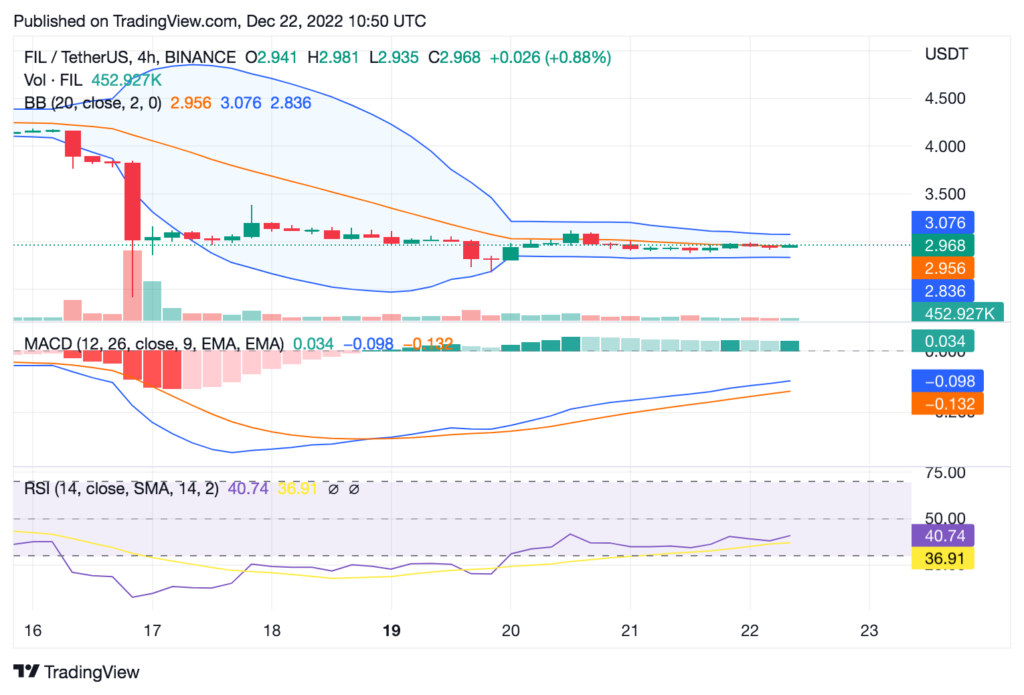
On the 4-hour price chart, Bollinger Bands are nipping and moving higher, signaling increased market volatility. The Bollinger Bands’ upper boundary of 3.077 and lower limit of 2.825 indicate a positive outlook. This bullish trend is strengthened by the fact that price action is on the verge of breaching the top band
Disclaimer: The views and opinions, as well as all the information shared in this price analysis, are published in good faith. Readers must do their own research and due diligence. Any action taken by the reader is strictly at their own risk, Coin Edition and its affiliates will not be held liable for any direct or indirect damage or loss.
Disclaimer: The information presented in this article is for informational and educational purposes only. The article does not constitute financial advice or advice of any kind. Coin Edition is not responsible for any losses incurred as a result of the utilization of content, products, or services mentioned. Readers are advised to exercise caution before taking any action related to the company.


