 Price Prediction 2025, 2026, 2027, 2028, 2029, 2030")
Flare (FLR) has just confirmed a major breakout from its descending structure, marking a decisive bullish shift for the asset. With strong volume support, RSI nearing overheated levels, and price lifting off from the long-term trendline, FLR may be entering a fresh cycle of accumulation and expansion into 2026 and beyond.
Flare (FLR) Price Prediction 2025
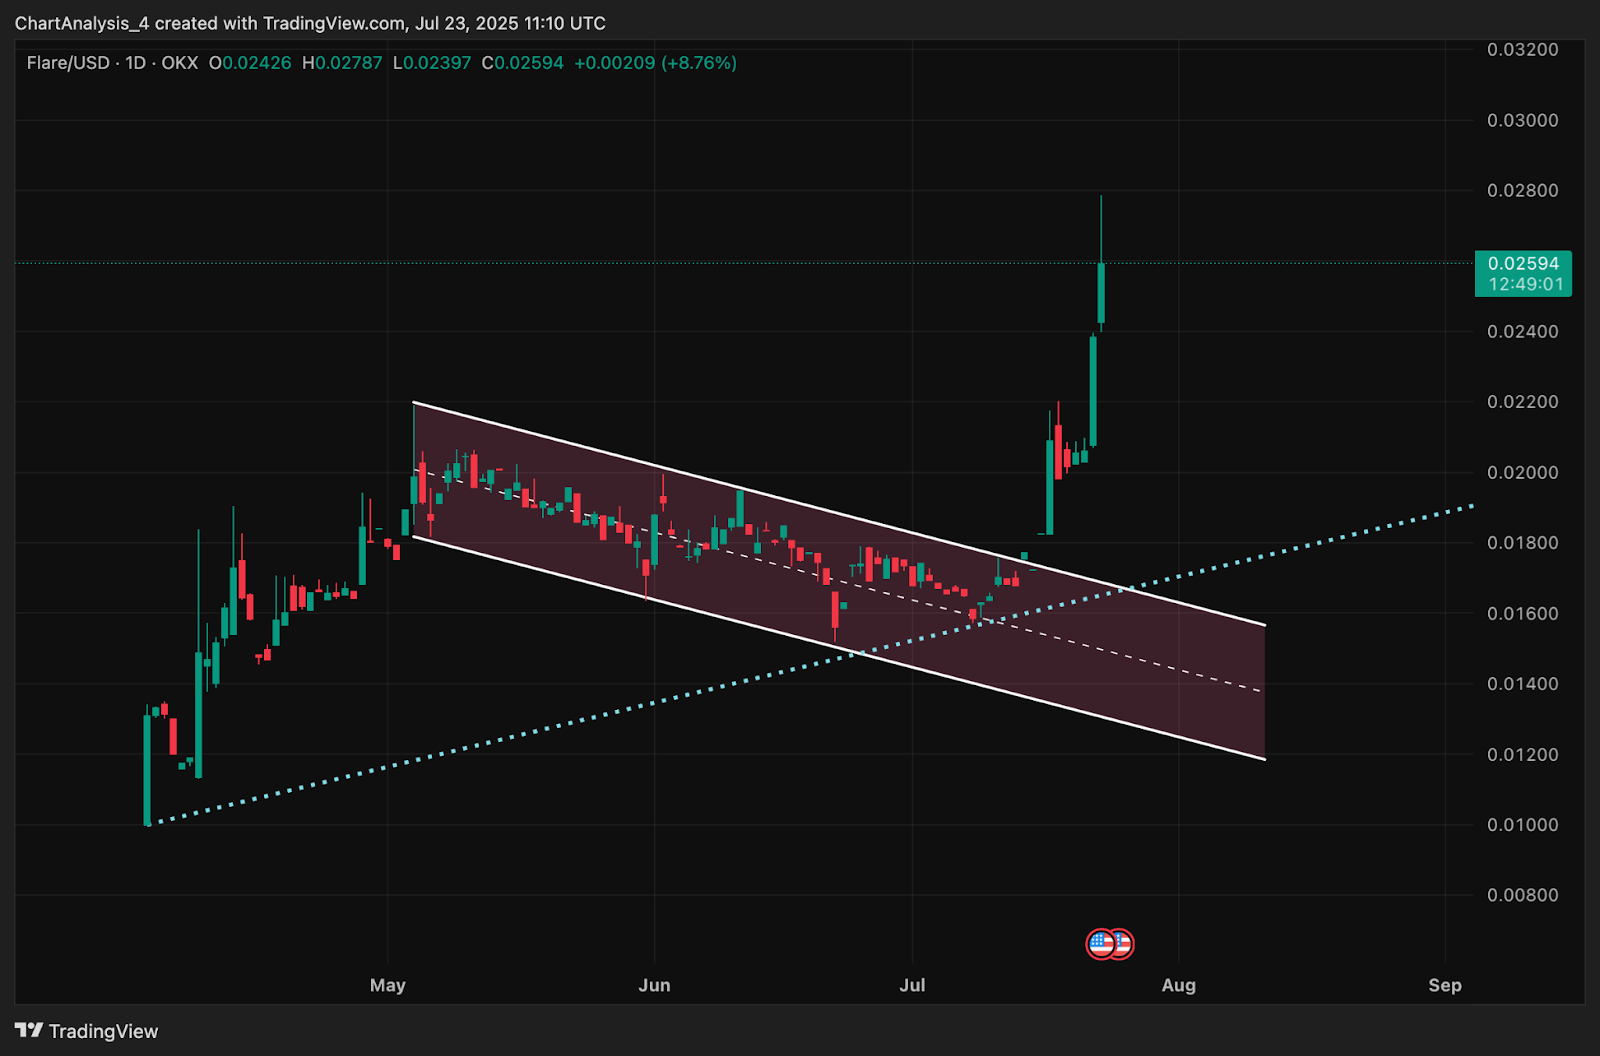
Flare price is trading around $0.025 after breaching the upper boundary of its multi-month falling channel. This breakout aligns with a larger ascending support trendline that held throughout the second quarter of 2025. After consolidating under the $0.019 zone for several weeks, bulls took control in late July, pushing price rapidly toward the $0.028 resistance mark.
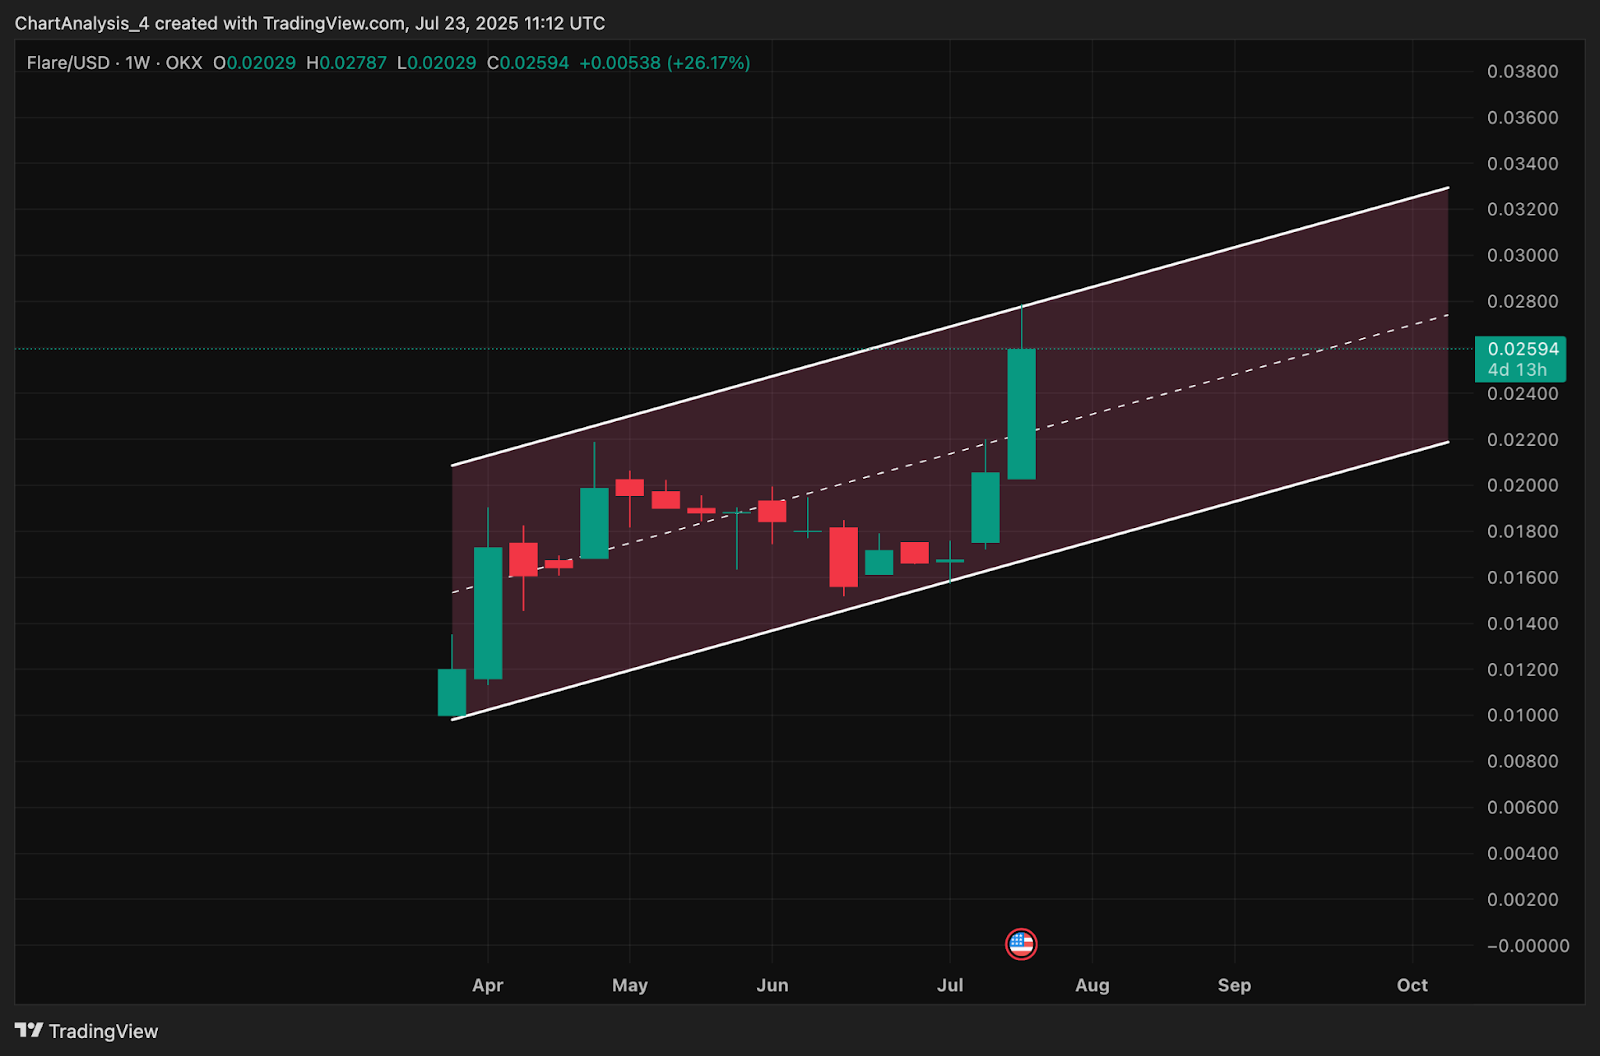
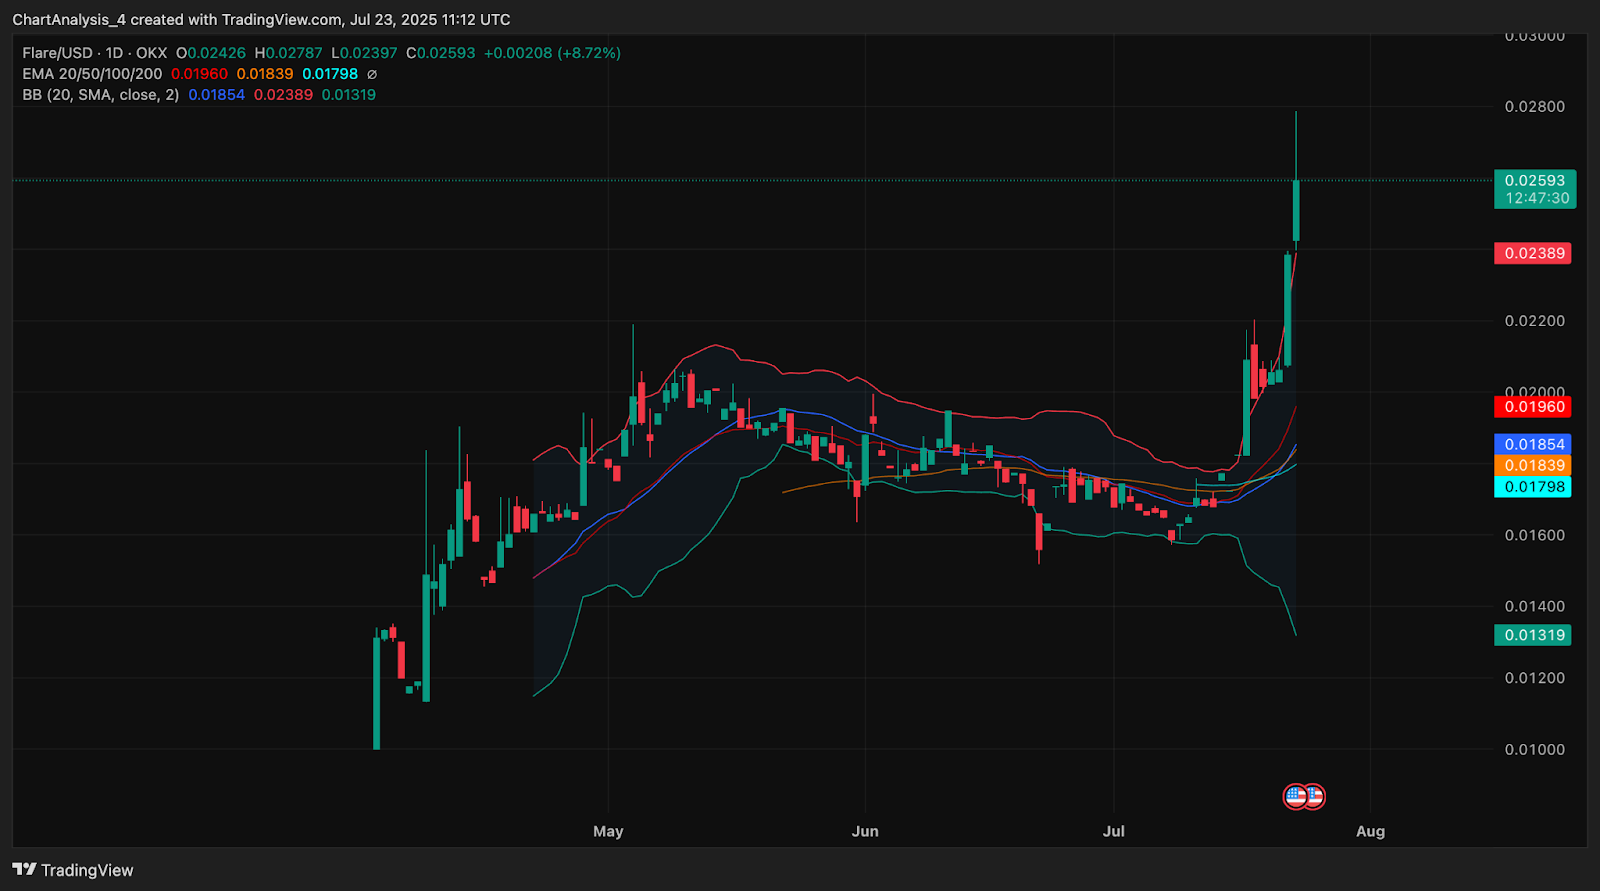
The weekly chart highlights an expanding bullish channel, and current price action is pressing against the median line, suggesting possible continuation if volume sustains. On the daily timeframe, FLR has reclaimed all major EMAs (20/50/100/200), with the Bollinger Bands sharply widening, reflecting volatility expansion.
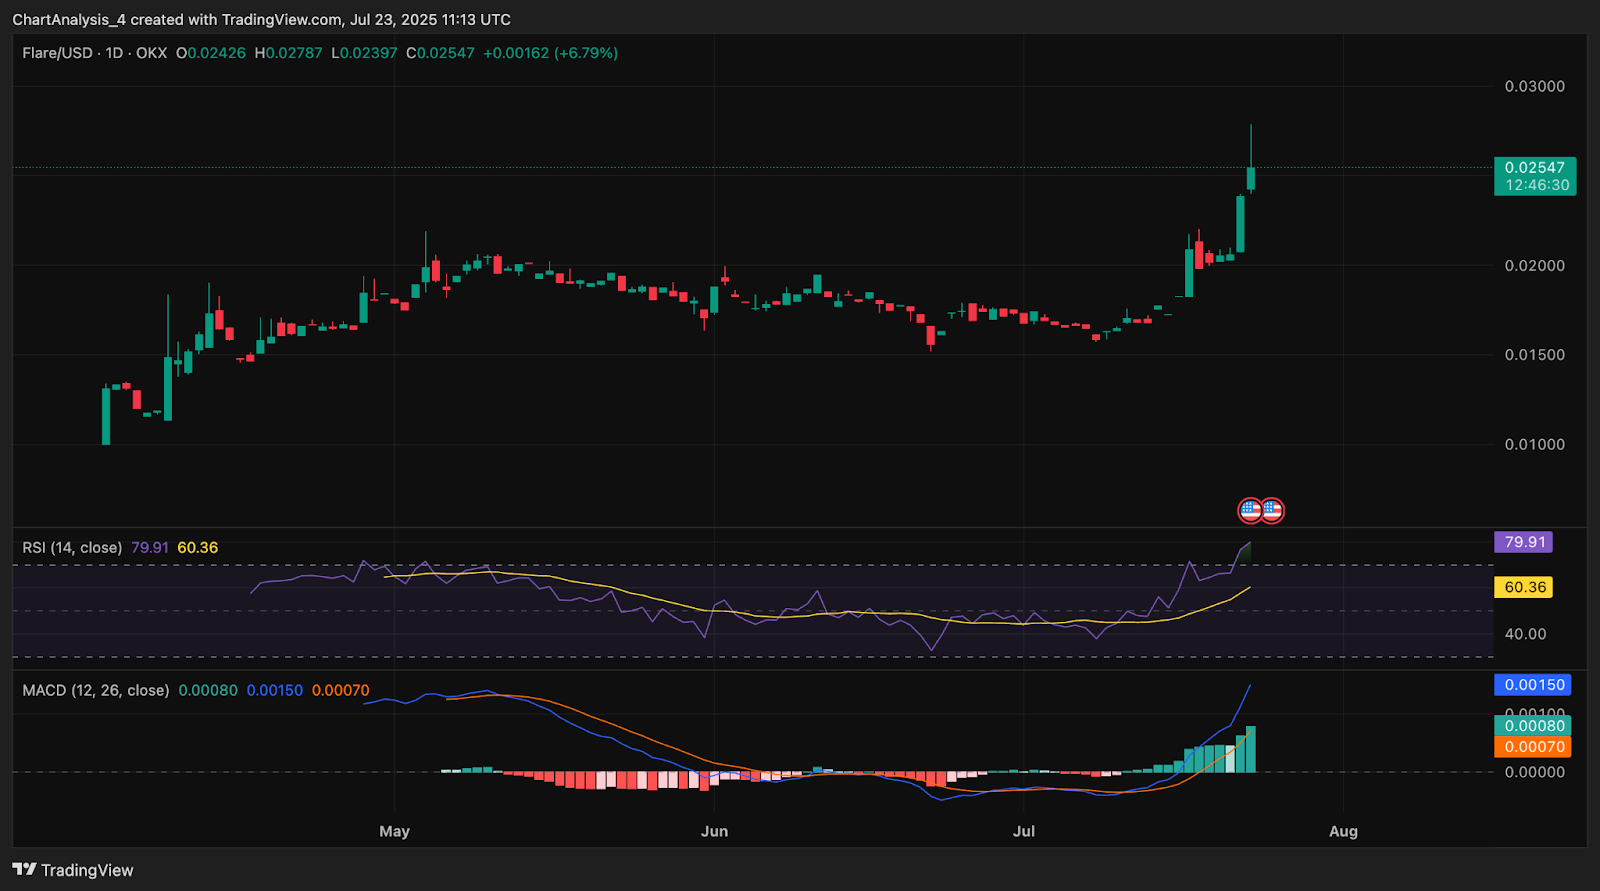
MACD has flipped into a bullish crossover, and RSI has crossed above 79 without any bearish divergence. Momentum indicators support further price extension, though a temporary pullback to the $0.020–$0.021 range may occur if profit-taking kicks in. Key resistance sits at $0.028, followed by $0.032, while short-term support is now visible near $0.022.
Flare (FLR) Price Analysis: Indicators, Signals and Charts (1y)
FLR has shifted from a prolonged compression phase into full breakout territory. The Bollinger Band expansion, RSI surge, and strong bullish MACD histogram all point toward trend strength. Weekly structure suggests that as long as FLR maintains closes above $0.020, bulls could steadily push toward the $0.030–$0.034 region in 2025. The reclaim of moving averages and upward channel structure favors a sustained breakout scenario.
Flare (FLR) Price Targets 2025 – 2030
| Year | Potential Low ($) | Potential Average ($) | Potential High ($) |
| 2025 | 0.018 | 0.024 | 0.034 |
| 2026 | 0.017 | 0.030 | 0.042 |
| 2027 | 0.023 | 0.036 | 0.050 |
| 2028 | 0.028 | 0.043 | 0.060 |
| 2029 | 0.033 | 0.050 | 0.072 |
| 2030 | 0.038 | 0.058 | 0.085 |
Flare (FLR) Price Prediction 2026
In 2026, Flare may enter a broad expansion phase, driven by increased usage of its native data provisioning protocols and smart contract applications. If FLR sustains above the $0.030 mark on weekly closes, a push toward $0.042 is likely. Downside retests near $0.017 could be temporary if wider market trends support risk-on sentiment.
Flare (FLR) Price Prediction 2027
Flare’s technical structure may complete a multi-year rounding bottom by 2027. This could open the door for a breakout move beyond the $0.050 psychological level. If the blockchain’s oracle ecosystem attracts wider adoption, FLR may form new price channels with average ranges hovering near $0.036.
Flare (FLR) Price Prediction 2028
By 2028, broader altcoin cycles and macro adoption of Layer-1 networks may help FLR test higher zones near $0.060. Stronger community traction, institutional listings, or integration into DeFi rails could support upward revisions. If trendline support holds, $0.043 could act as the next consolidation base.
Flare (FLR) Price Prediction 2029
In 2029, FLR could benefit from another altcoin surge, especially if the token’s staking or ecosystem utility improves. Technically, the asset may form a higher high structure, with price potentially climbing toward $0.072. Intermediate support may be seen around $0.050 as price trends upward within a broadening wedge.
Flare (FLR) Price Prediction 2030
Looking ahead to 2030, Flare may approach its long-term price discovery zone. If market maturity coincides with growing enterprise adoption of on-chain data solutions, FLR could reach toward $0.085. The average may stabilize near $0.058, assuming volatility and liquidity remain intact through multiple cycles.
Conclusion
Flare has shifted decisively out of a multi-month downtrend, reclaiming key technical zones with strong momentum. The recent rally backed by expanding volume, bullish indicator crossovers, and trendline validation gives FLR a constructive setup for 2025. While consolidation phases will continue across the coming years, the foundation built in 2025 may act as a springboard toward sustained multi-year upside through 2030.
Disclaimer: The information presented in this article is for informational and educational purposes only. The article does not constitute financial advice or advice of any kind. Coin Edition is not responsible for any losses incurred as a result of the utilization of content, products, or services mentioned. Readers are advised to exercise caution before taking any action related to the company.


