 Price Prediction for July 18")
The Floki price today is holding firm near $0.0001310, consolidating gains after a clean breakout from a textbook cup and handle formation. This bullish structure has been in development since early 2025 and is now triggering a shift in macro sentiment. With the neckline zone around $0.0001200 decisively breached and strong volume inflow confirmed, market participants are now eyeing the $0.0001427 and $0.0002043 resistance levels on the weekly chart.
What’s Happening With Floki’s Price?
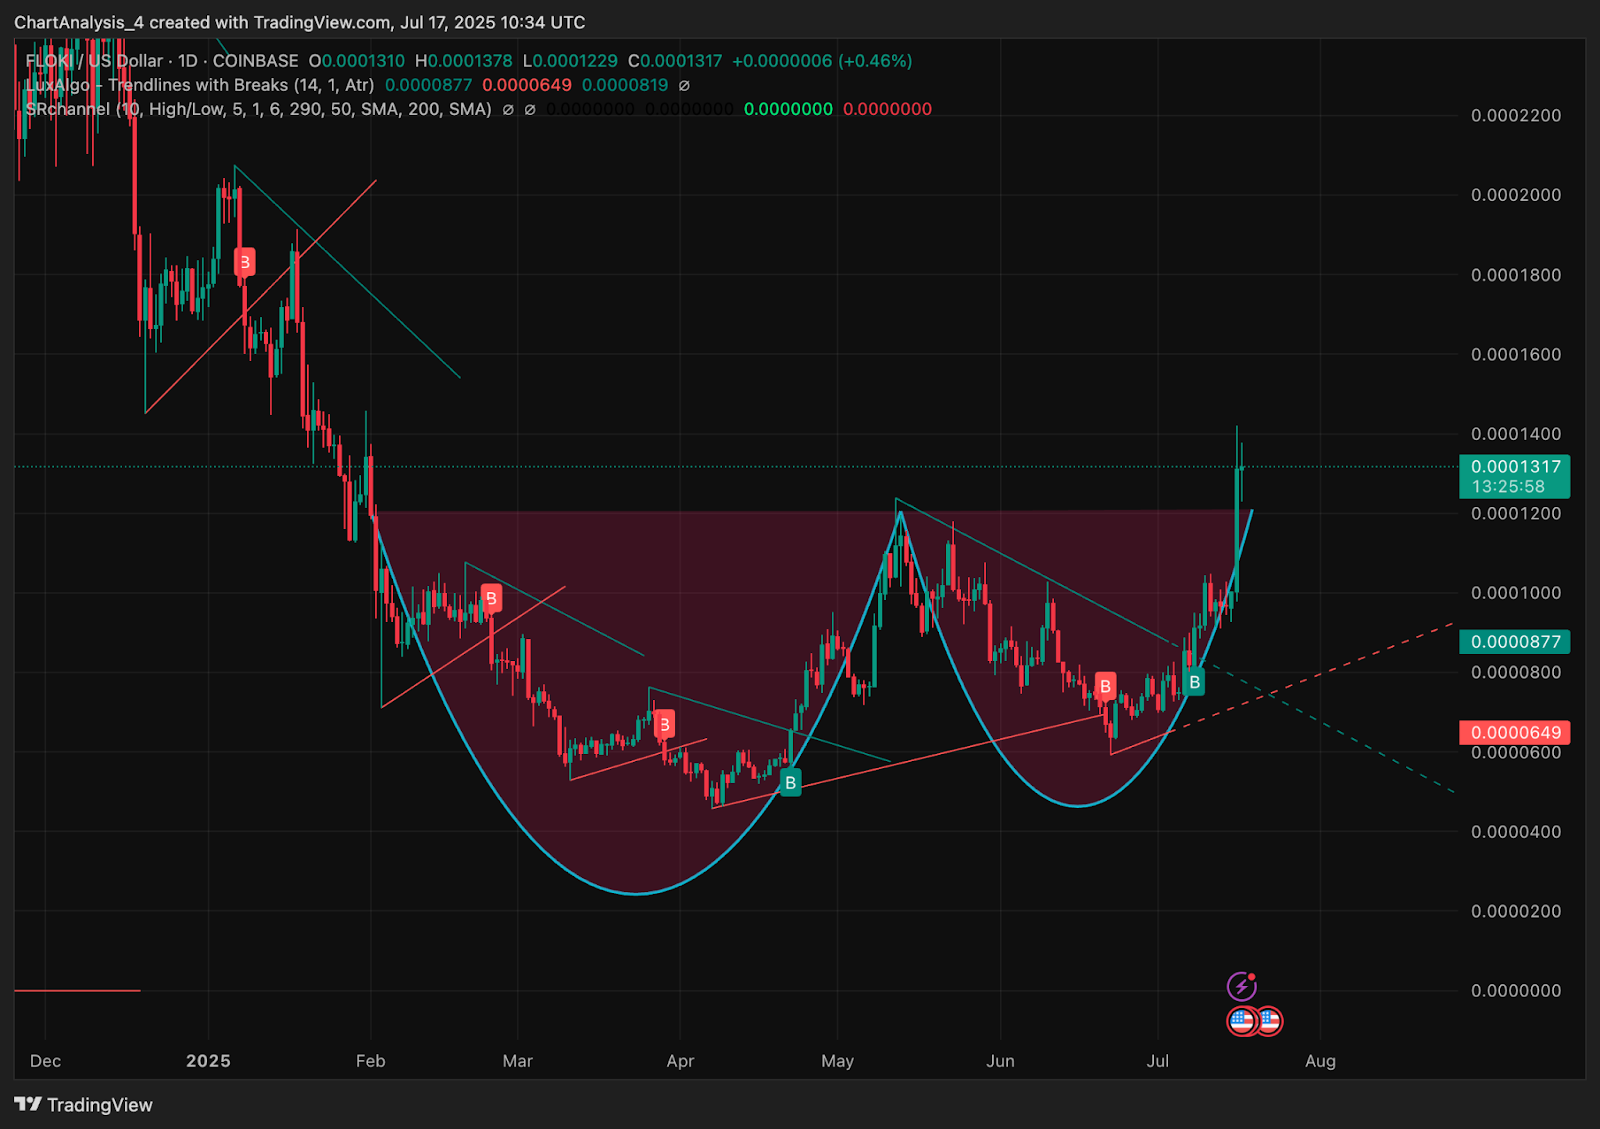
On the daily chart, Floki price action shows a fully validated cup and handle breakout. After retesting the neckline around $0.0001200, the price surged to an intraday high of $0.0001378, before pulling back slightly to consolidate near $0.0001310. The structure shows symmetry and depth, with both cups forming higher lows, signaling accumulation beneath resistance.
The pattern also coincides with a macro change of character (CHoCH) and a bullish break of structure (BOS), as seen in the smart money concept overlay. With price now trading above all major trendline resistances and structural supply zones, bulls appear firmly in control.
Why Is the Floki Price Going Up Today?
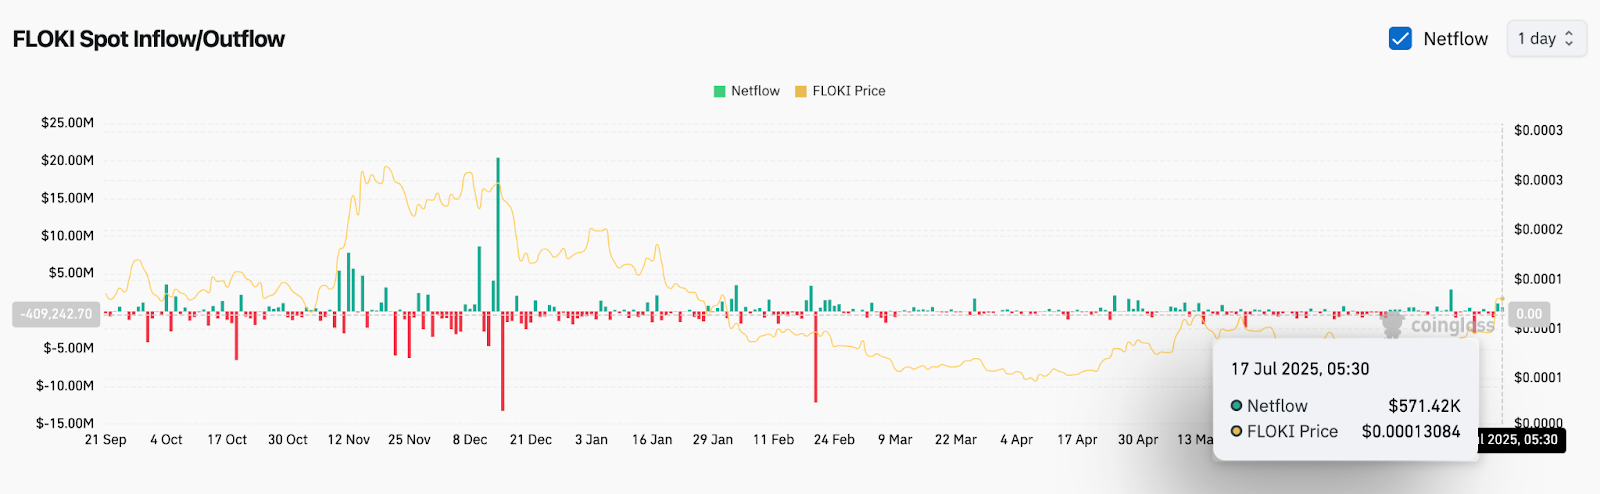
Why Floki price going up today can be attributed to a combination of technical breakout confirmation and positive netflow activity. According to Coinglass data, FLOKI saw over $571K in net inflow on July 17 — its highest single-day net gain in weeks. This aligns with the volume spike and breakout candle seen on the daily chart.
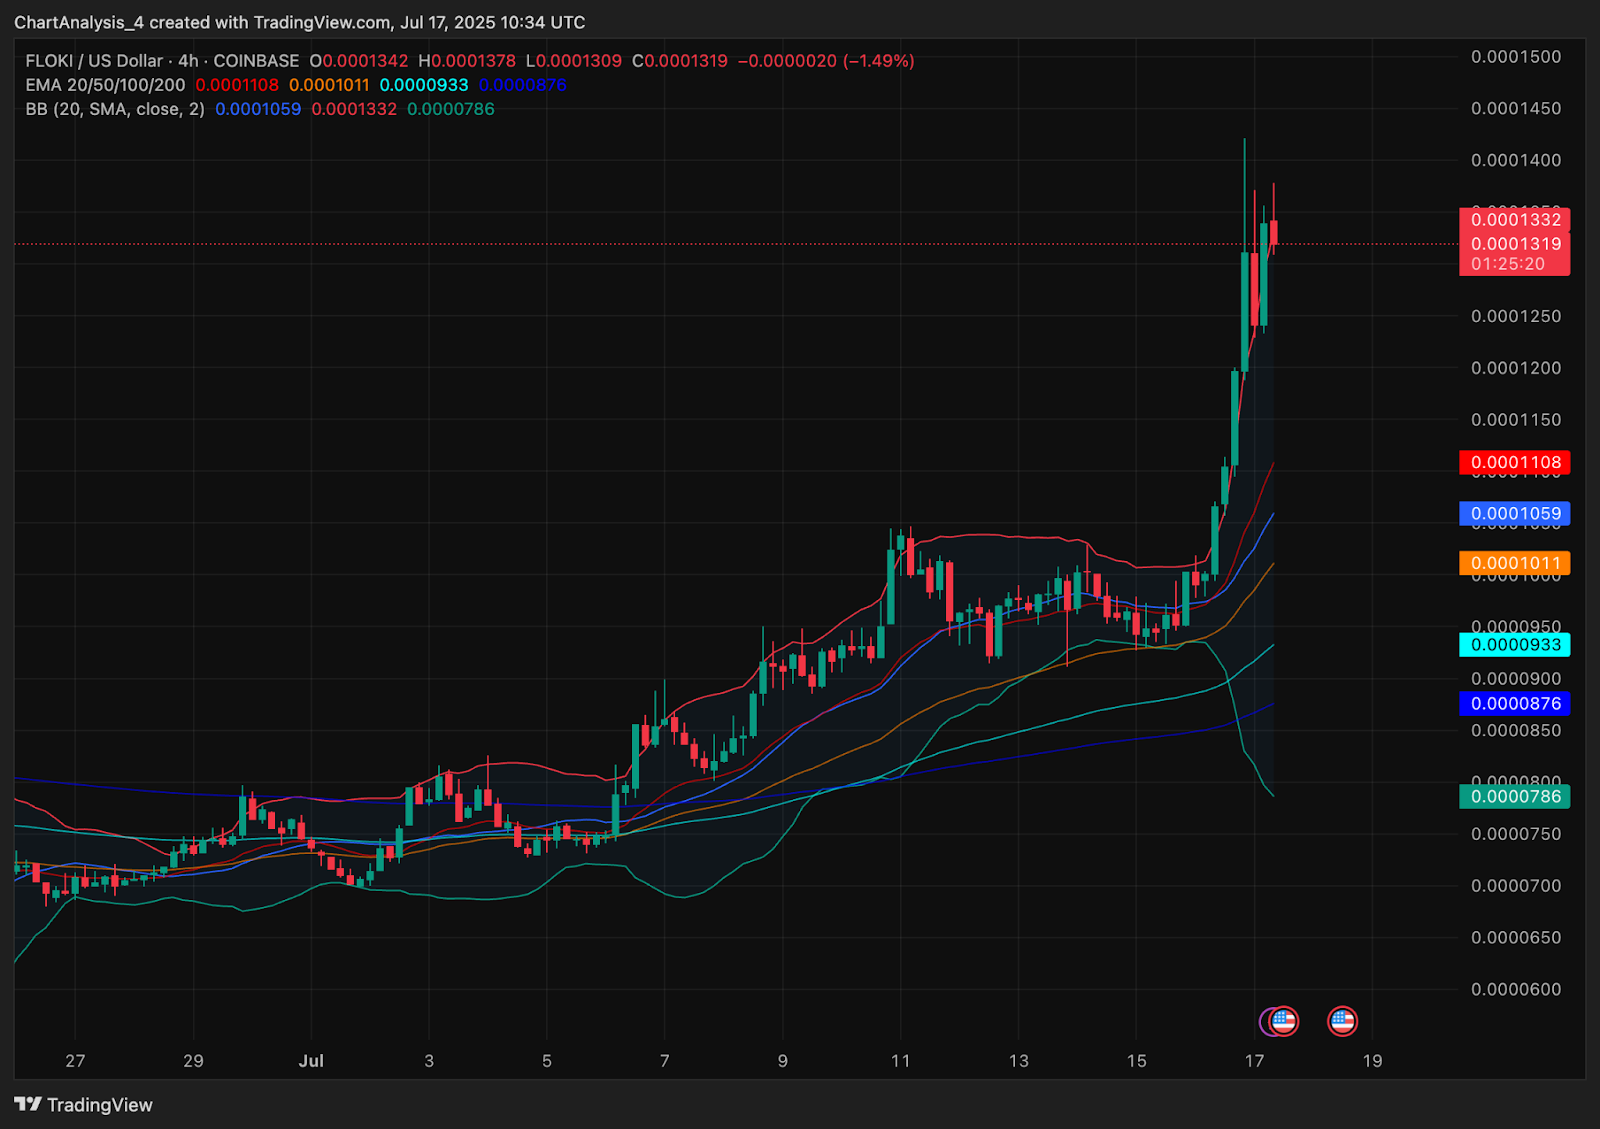
The 4-hour Bollinger Bands are expanding sharply after a volatility squeeze, with price pressing against the upper band at $0.0001332. The 20/50/100/200 EMAs are now tightly stacked below price, with the 200 EMA at $0.0000876 offering a strong dynamic support base. This alignment confirms that short-term trend momentum is bullish.
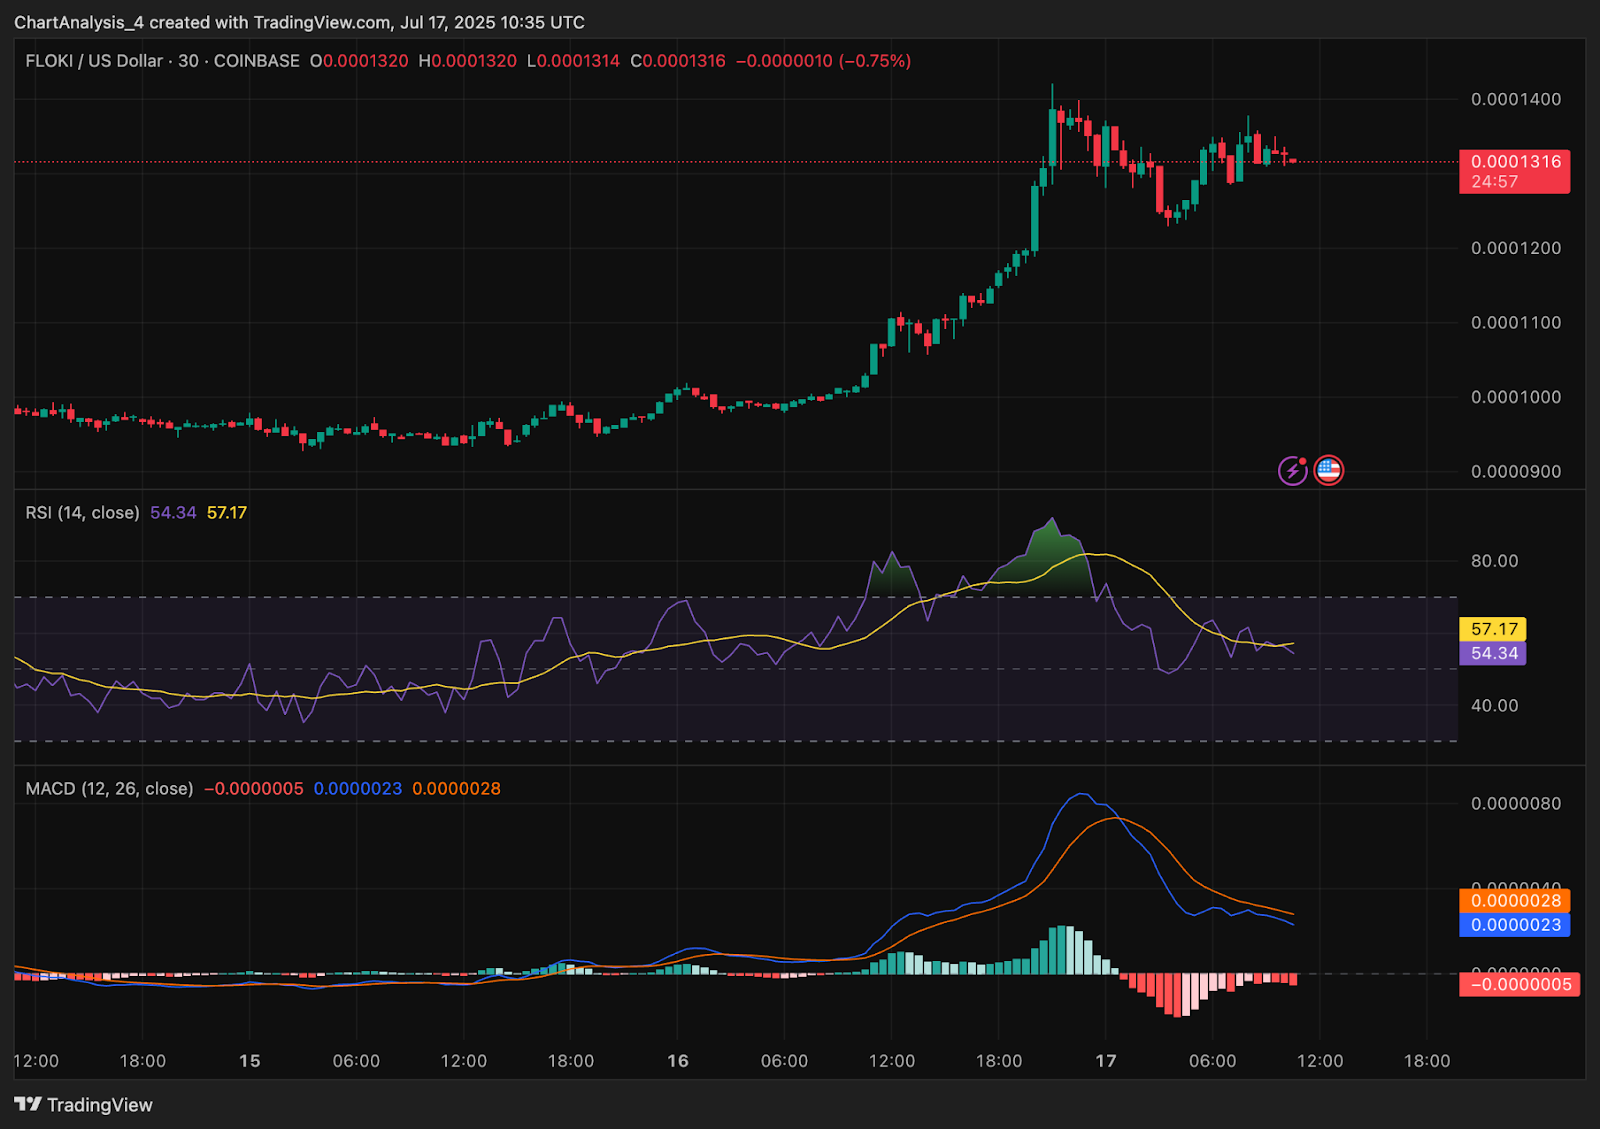
From a momentum perspective, the RSI on the 30-minute chart recently reached overbought levels above 70 before cooling to 57. This healthy reset, while price holds gains, suggests continuation potential. The MACD shows a minor bearish crossover on the 30-minute timeframe, but histogram bars are flattening, indicating potential for renewed bullish momentum.
Momentum Indicators and Smart Money Signals
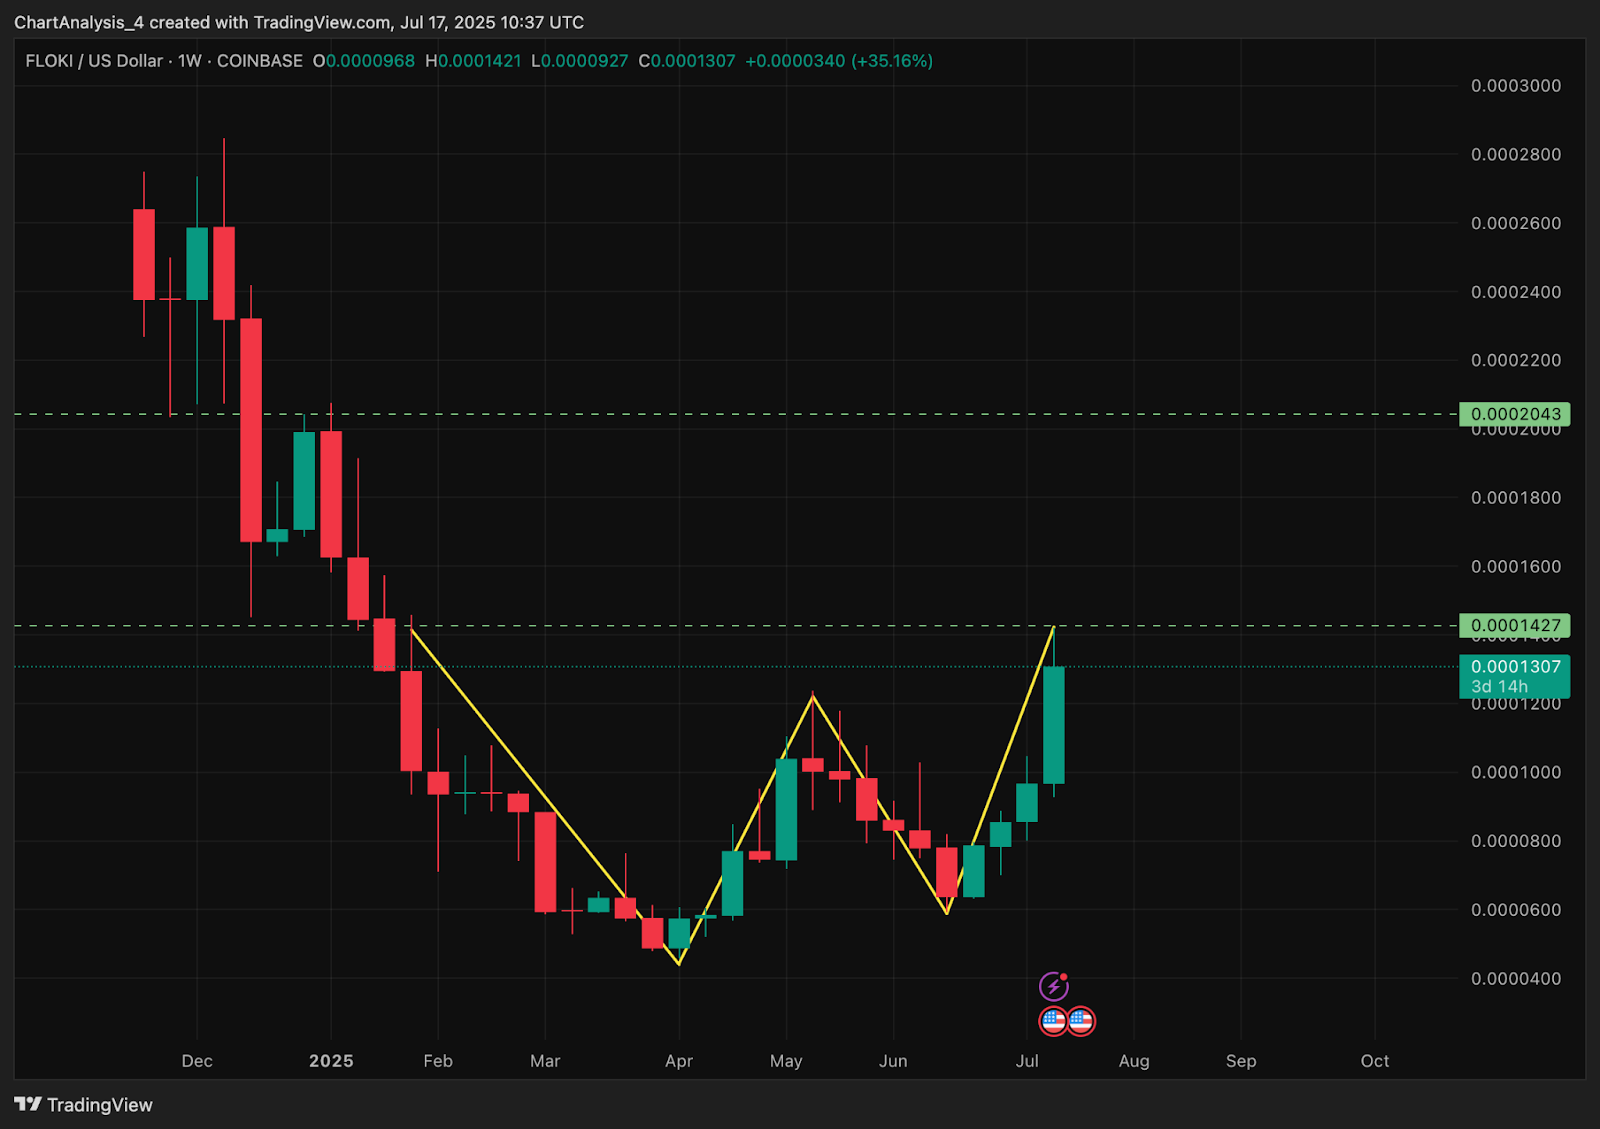
The weekly chart reinforces the strength of this move. FLOKI has just completed a double V-shaped recovery, pushing toward the $0.0001427 level that served as resistance in April. If this weekly candle closes above $0.0001300, it would mark the strongest weekly close since December 2024 and confirm macro trend reversal.
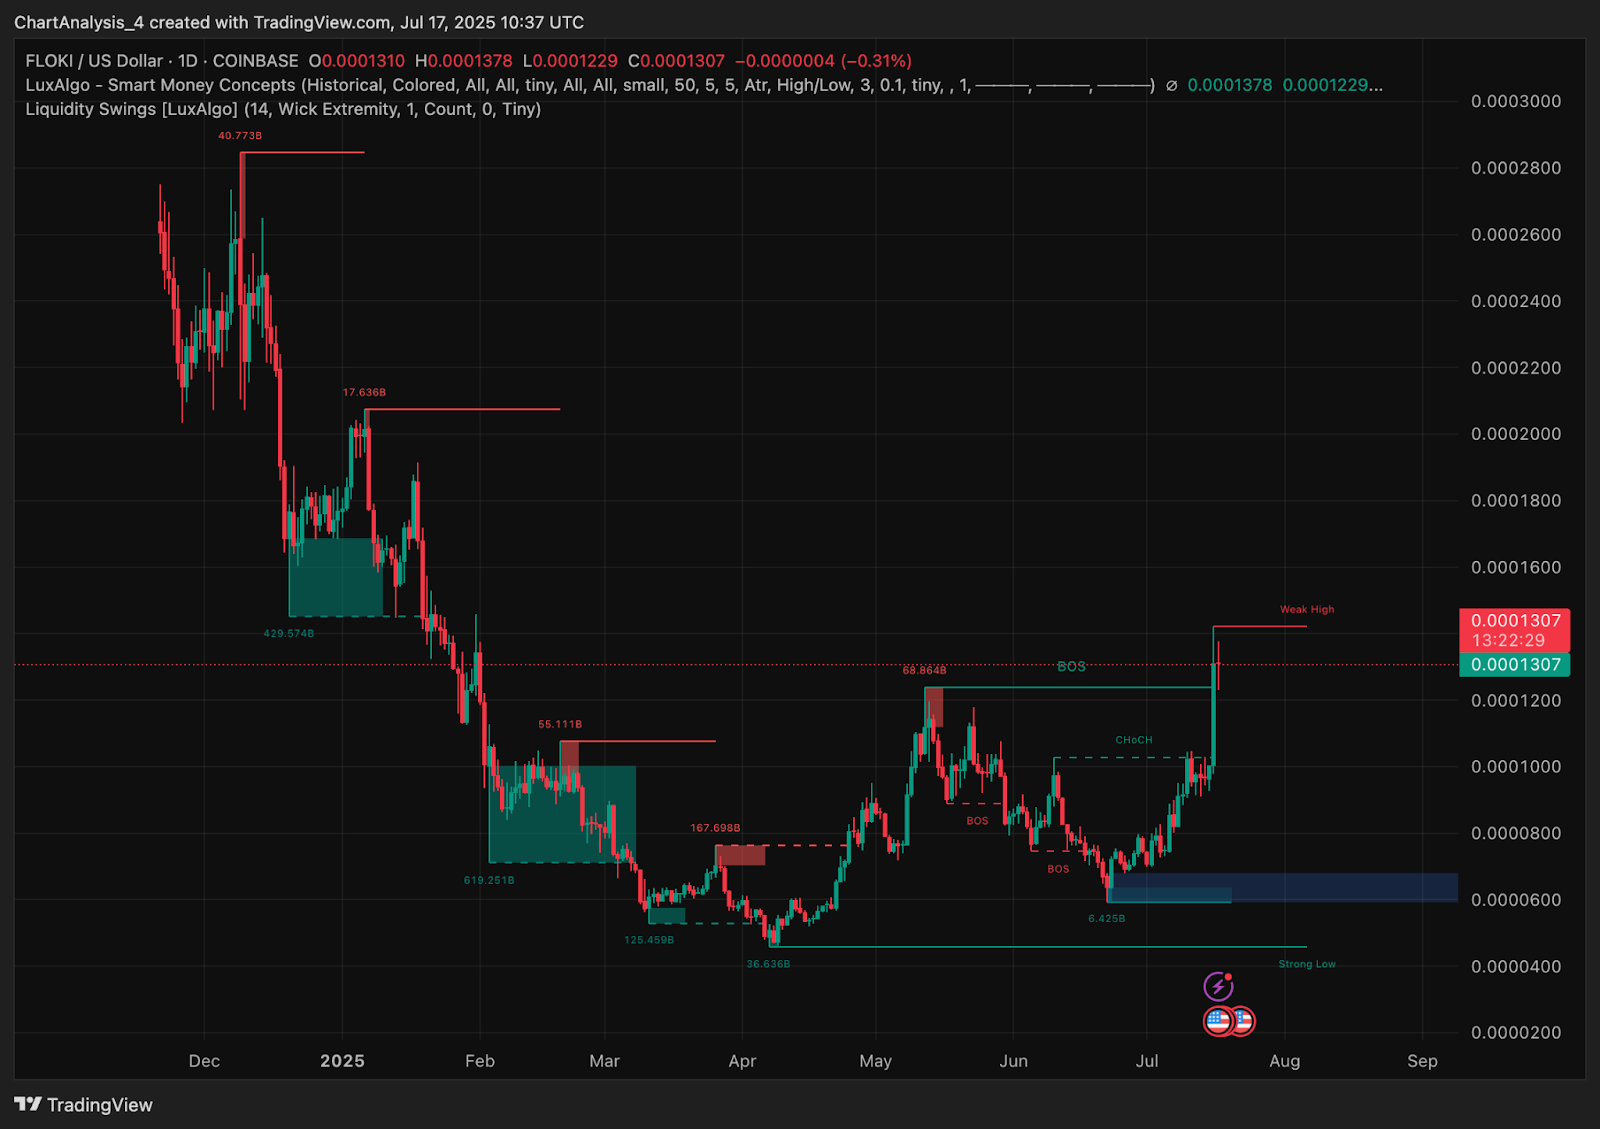
Smart Money Concepts show multiple bullish BOS levels, with the most recent swing high at $0.0001378 acting as immediate resistance. Price is now above the previous CHoCH and hovering near a weak high, a zone that could trigger further upside if demand persists.
Spot inflow/outflow trends also support a bullish outlook. The positive net inflow on July 17 confirms institutional and whale demand re-entering the market, likely fueled by technical breakout setups.
Floki Price Prediction: Short-Term Outlook (24H)
In the near term, the Floki price may attempt another breakout toward $0.0001427. If price closes above this level with volume confirmation, the next resistance lies at $0.0002043, which also aligns with the weekly inefficiency zone.
On the downside, immediate support is seen near $0.0001200 — the former neckline zone — followed by the $0.0001080 level, which aligns with the 50 EMA. A breakdown below this level would invalidate the breakout and shift the focus back to the $0.0000933 support band.
Given the bullish EMA structure, strong spot net inflows, and confirmation of a macro breakout, the outlook remains constructive unless key support levels fail. However, with short-term RSI near 57 and MACD flattening, traders should watch for a brief consolidation before continuation.
Floki Price Forecast Table: July 18, 2025
| Indicator / Zone | Level / Signal |
| Floki price today | $0.0001310 |
| Resistance 1 | $0.0001378 (recent high) |
| Resistance 2 | $0.0001427 (weekly resistance) |
| Resistance 3 | $0.0002043 (macro target) |
| Support 1 | $0.0001200 (cup-and-handle neckline) |
| Support 2 | $0.0001080 (EMA50 zone) |
| EMA Cluster (20/50/100/200, 4H) | All stacked below price (bullish) |
| RSI (30-min) | 57.17 (cooled from overbought) |
| MACD (30-min) | Bearish crossover, flattening |
| Bollinger Bands (4H) | Expanding, breakout confirmation |
| Netflow (July 17) | +$571.42K (bullish inflow) |
| Weekly Structure | Double-V recovery, bullish breakout |
| Pattern | Cup and handle breakout |
Disclaimer: The information presented in this article is for informational and educational purposes only. The article does not constitute financial advice or advice of any kind. Coin Edition is not responsible for any losses incurred as a result of the utilization of content, products, or services mentioned. Readers are advised to exercise caution before taking any action related to the company.


