
- FTX/Alameda’s $1B SOL unstaking signals potential market volatility for Solana.
- SOL’s $134 support, $135.05 resistance key in shaping near-term price movement.
- Neutral RSI and MACD below signal line suggest potential short-term price decline.
FTX and Alameda Research have unstaked a massive amount of Solana ($SOL) — over $1 billion worth — in the past three months. According to Lookonchain data, this significant unstaking activity involves 530,000 $SOL valued at $71 million, spread across multiple addresses.
On average, these entities have unstaked roughly 176,700 $SOL per month, equivalent to $23.5 million. FTX/Alameda still holds a sizable 7.06 million $SOL, valued at approximately $945.7 million.
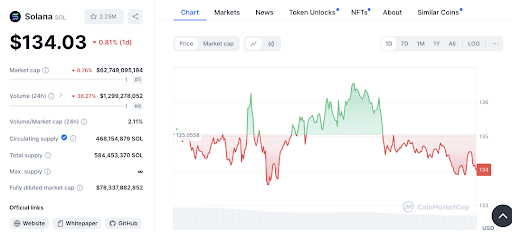
This substantial unstaking could influence Solana’s current market dynamics. At press time, Solana’s price sits at $134.21, down 0.64% over the last 24 hours. Examining the price chart reveals key support and resistance levels that could shape future price movements.
Read also: SOL Gains Over 10%; Can the Price Climb to $40 Handle?
Support and Resistance: Key Levels to Watch
The $134 mark acts as near-term support for Solana. The price has hovered around this level, suggesting it’s a critical point of interest. If the price breaks below $134, we could see further declines.
On the flip side, $135.05 represents a significant resistance level. The price briefly tested this point before retreating. A decisive move above $135.05 could signal a bullish trend and potentially drive the price higher.
Trend Analysis: Solana’s Price Fluctuates
Over the past day, Solana’s price has fluctuated within the $133 to $136 range, indicating volatility. The trend has shown oscillations between bearish and bullish zones. A breakout above $135.05 could lead to an uptrend continuation. On the other hand, a break below $134 may push the price down toward the $133 range.
Read also: Analyst Says SOL Will Hit 20% of ETH’s Market Cap in Next Bull Rally
The 1-day Relative Strength Index (RSI) for Solana stands at 48.28. This suggests that Solana is currently in neutral territory, neither overbought nor oversold.
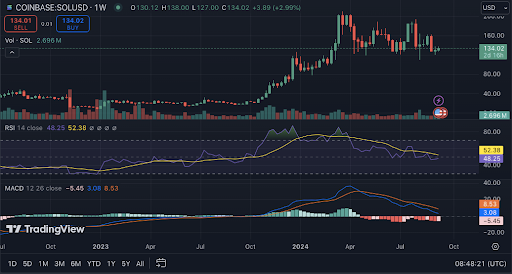
Additionally, the 1-day Moving Average Convergence Divergence (MACD) is trading below the signal line, hinting at potential downward pressure in the short term.
Disclaimer: The information presented in this article is for informational and educational purposes only. The article does not constitute financial advice or advice of any kind. Coin Edition is not responsible for any losses incurred as a result of the utilization of content, products, or services mentioned. Readers are advised to exercise caution before taking any action related to the company.


