


- Solana price analysis shows a bullish trend.
- The coin is facing strong rejection at $40.
- Support for SOL is currently present at $34.65.
Recent Solana price analysis indicates the digital asset has hit an intra-day high of $38.87. Solana prices have been fluctuating between a range of $38.87 and $34.64 and have settled at $38.39. At the time of writing, Solana was trading up by 10.21% against the US dollar and was priced at $37.38. The digital asset has a market capitalization of $13.6 billion, with a 24-hour trading volume of $1,760,654,097.26.
Solana price analysis on the daily price chart indicates the digital asset has been on a clear uptrend in the last 24 hours amid broader market optimism. After trading sideways for a while, the crypto finally breached above the $37 resistance level yesterday afternoon and went on to set a new ATH of $38.87.The weekly gains are also amounting to 13%, which is a hopeful indication; the trading volume has also increased by 53.9% today.
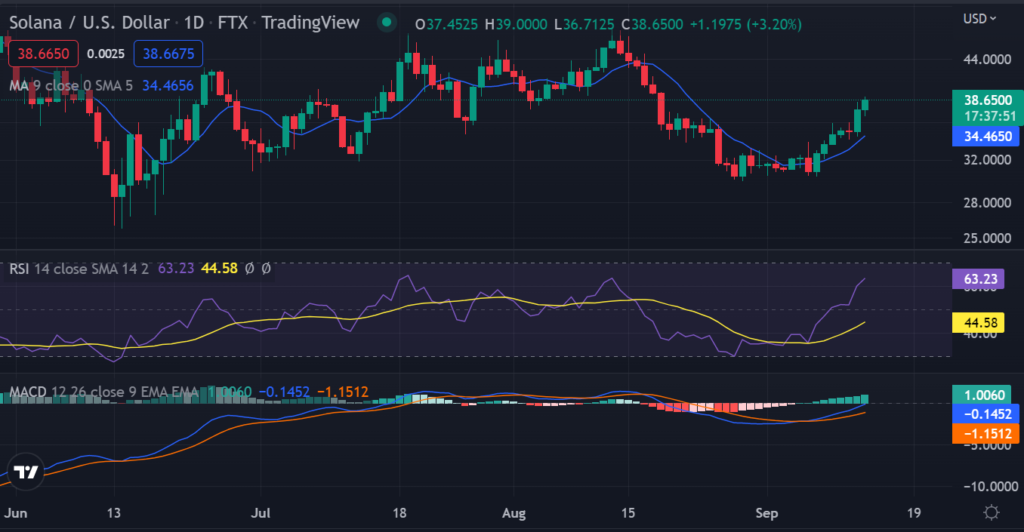
The moving average (MA) is also moving upwards and is present at $32.2, and a crossover with SMA 50 is highly expected in the coming hours.
The overall technical indicators are pointing to the positive as the RSI is currently at 70, and the MACD line has crossed above the signal line. The Parabolic SAR markers are currently below the price candles, indicating a bullish trend for Solana in the short term.
The Relative Strength Index indicator is currently residing in the overbought zone, which might signal a possible bearish correction in the near future. The RSI line is currently at 63.12, and it has shown a downward movement in the past few hours.
Solana price analysis on the 4-hour price chart shows the clear bullish sentiment is likely to continue in the short term as the price is currently testing the $40 resistance level. The moving averages are also sloping upwards, and a crossover between SMA 10 and SMA 50 might take place in the next few hours.
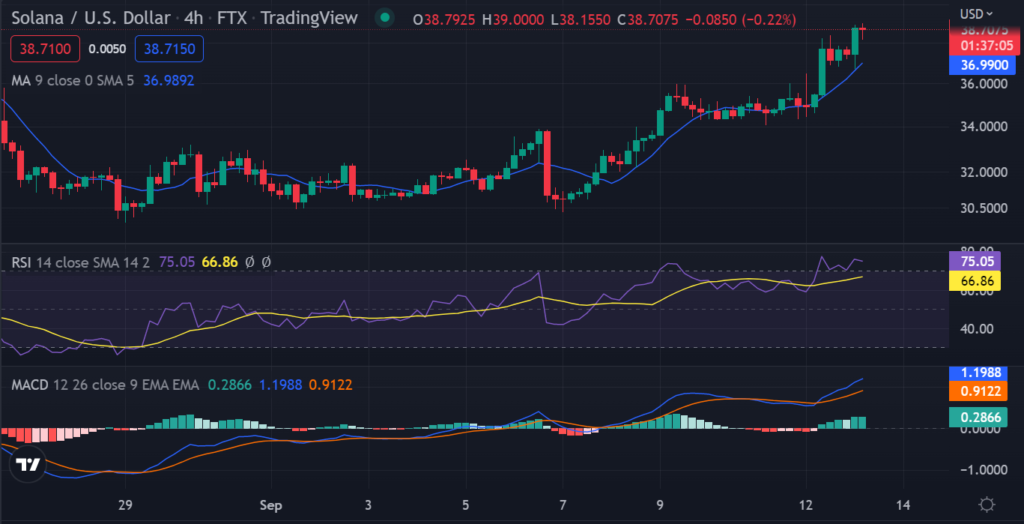
The overall technical indicators are also pointing to the positive as the RSI is currently at 64.53 and has shown a slight downward movement in the past few hours. The MACD line has also crossed above the signal line, indicating a possible bullish trend for Solana in the near future
Solana price movement over the last 4 hours has seen the green candle close (as of writing) at $40.20, indicating a potential move to $41.04. The digital asset is facing strong rejection at $40 and might need some time to consolidate before it can move higher.
Solana price analysis indicates that the bulls are currently in control of the digital asset’s price as it is trading above the $34.65 support level. The price has reached the $38.39 level, and further recovery seems possible. Investors can expect SOL to continue moving upwards for today. However, selling pressure may return near the $36.4 level.
Disclaimer: The views and opinions, as well as all the information shared in this price prediction, are published in good faith. Readers must do their research and due diligence. Any action taken by the reader is strictly at their own risk. Coin Edition and its affiliates will not be held liable for any direct or indirect damage or loss.
Disclaimer: The information presented in this article is for informational and educational purposes only. The article does not constitute financial advice or advice of any kind. Coin Edition is not responsible for any losses incurred as a result of the utilization of content, products, or services mentioned. Readers are advised to exercise caution before taking any action related to the company.
 Price Prediction 2026-2030: Will LTC Hit $80 Soon?")


 Price Prediction 2026, 2027, 2028, 2029, 2030-2050")
