


- Lookonchain reported that FTX unstaked 3.96 million SOL two days ago and transferred 750,000 SOL to Binance and Kraken.
- The crypto community was expecting the sell pressure to increase in the future.
- RSI formed a bearish crossover, making the altcoin’s price to produce two new red candlesticks.
Lookonchain, a market analytics platform, recently reported on X that FTX unstaked 3.96 million SOL two days ago and transferred 750,000 SOL to Binance and Kraken. At the time of reporting, Lookonchain estimated that the value of 750,000 SOL was approximately $30 million. It seems that the comment section was flooded with the crypto community anticipating sell pressure and the end of the bull season in the SOL market.
On November 3, Lookonchain also pointed out that FTX had transferred a total of 1.1 million SOL, valued at approximately $42.35 million. FTX also transferred 7,183 ETH, which was approximately $12.9 million. Overall, it was reported on that day that FTX had transferred $221.7 million in crypto assets. However, despite the major sell-offs by FTX, it has been reported that SOL experienced a double-digit surge of 19.12% in seven days.
Even now, SOL, Solana’s native token, still maintains a 16%+ spike in the market over the seven day period and remains to trade above $40. However, observing the one-day chart, SOL witnessed a fall of 3.42%, according to CoinMarketCap. At the reported time, Solana was changing hands at $40.37.
The trading volume was valued at $900,291,525, after making a tumble of 8.06% in 24 hours. This negative presence of trading volume is often viewed as an indication that the trader’s interest and demand for this particular altcoin may be diminishing. Meanwhile, the market capitalization of SOL is valued at $16,958,785,373, placing it in the seventh position based on market capitalization.
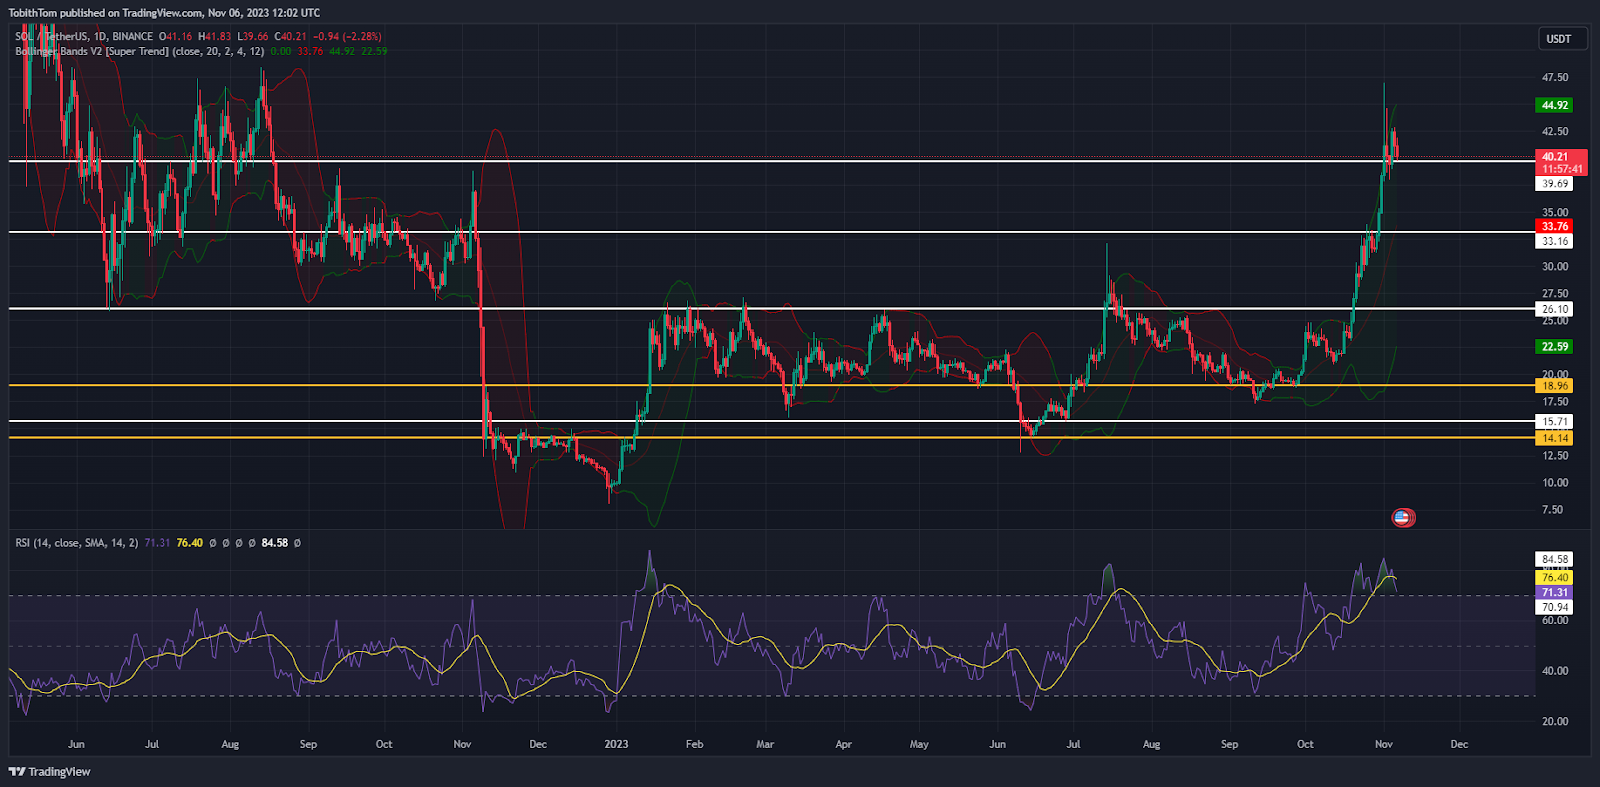
Looking at the SOL/USDT 1-day chart, the candlesticks were tightly hugging the upper bands of the Bollinger Bands for a long time. However, recently, the RSI formed a bearish crossover, making the altcoin’s price produce two new red candlesticks.
Disclaimer: The information presented in this article is for informational and educational purposes only. The article does not constitute financial advice or advice of any kind. Coin Edition is not responsible for any losses incurred as a result of the utilization of content, products, or services mentioned. Readers are advised to exercise caution before taking any action related to the company.


